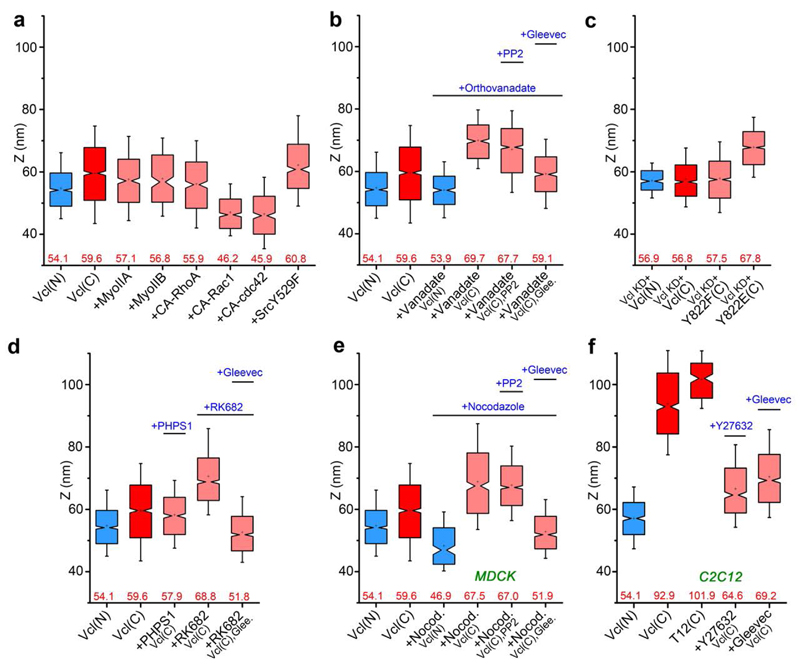
Figure 5. Vinculin conformation is modulated by tyrosine phosphorylation and tension.
Notched box plots for vinculin z-positions. Blue and red: N- and C-terminal z-positions of vinculin wt coral: vinculin C-terminal z-position with perturbations. a, Overexpression of myosin IIA and IIB, constitutively active (CA) RhoGTPases (RhoA, Rac1, cdc42) and Src kinase. b, Treatment with orthovanadate, PP2, and Gleevec. c, Vinculin Y822 phosphorylation mutants (Y822F, and Y822E) in MDCK vinculin-KD cells. d, Treatment with PHPS1, RK682 and Gleevec. e, Vinculin in MDCK cells, treated with nocodazole and PP2 or Gleevec. f, Vinculin in C2C12 cells, treated with Y-27632 or Gleevec. Notched boxes in a-f indicate first and third quartiles, median and confidence intervals; whiskers, 5th and 95th percentiles. Numbers indicated in a-f: median zcentre (red). n values (number of adhesions) for each box plot, the number of cells, and statistical comparison are described in Supplementary Tables 3 and 4.

