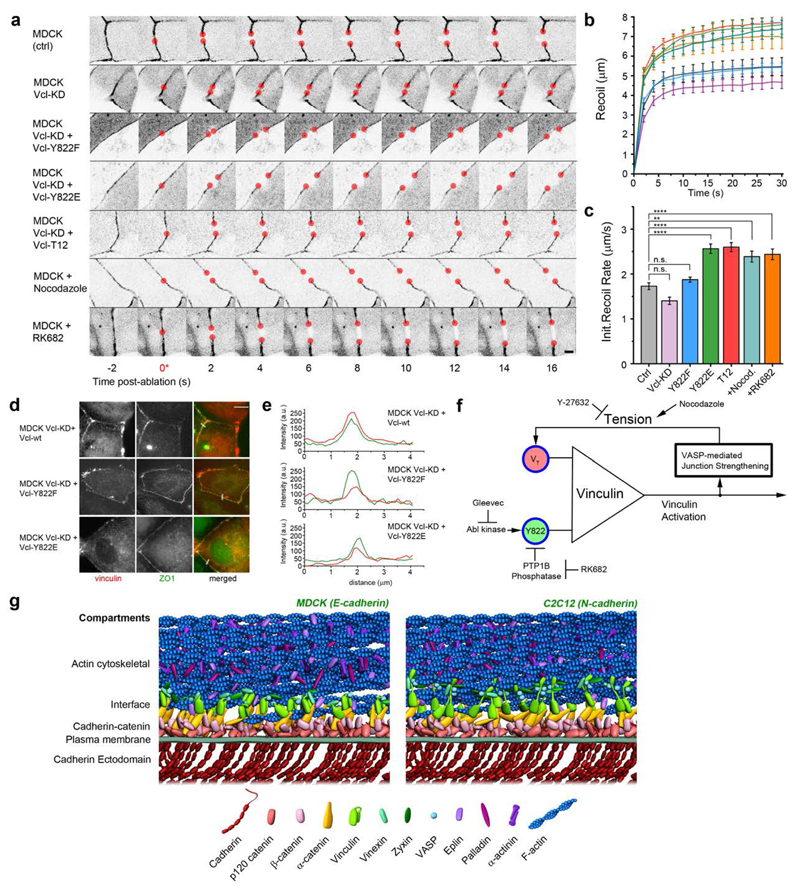
Figure 6. Integration of mechanical and biochemical signals by vinculin regulates mechanical properties of cell-cell contacts.
a, MDCK cells were cultured on fibronectin-coated substrate to form confluent monolayers, with cell-cell contacts labelled by ZO1 fused with either mEmerald or mCherry. Cells were co-transfected with vinculin constructs or treated with pharmacological inhibitors as indicated. Montage of consecutive frames (interval: 2 s) shown with junction excision at t= 0 s (*). Recoiling edges of the junctions (red circles) were used to quantify the recoil trajectory. Untreated MDCK (ctrl) were compared with MDCK stably expressing shRNA against vinculin (MDCK Vcl-KD), MDCK Vcl-KD rescued with Y822F, Y88E, or T12 vinculin mutants, MDCK cells treated with Nocodazole (to promote contractility, 10μM for 1 h), and RK682 (PTP1B inhibitor to inhibit Y822 dephosphorylation, 10 μg/ml for 1 h). Scale bar, 5 μm. Junction recoil (b) and initial recoil rate (c) upon laser ablation of native cell-cell junctions in MDCK epithelial monolayer, with vinculin mutants, or pharmacological treatment. Colors of plots in (b) correspond to bar graphs in (c). Ablation occurred at 0 s. Data in b and c represent mean +/- Error bars (s.e.m). n values: 19 (ctrl); 18 (Vcl-KD); 16 (Vcl-KD + Y822F); 17 (Vcl-KD+Y822E); 18 (Vcl-KD+Vcl-T12); 11 (+Nocodazole); 24 (+RK682). **: p < 0.005, ****: 5 x 10⁻⁵. Statistics in Supplementary Tables 6 and 7. d, Fluorescence micrographs of MDCK vinculin KD epithelial monolayer rescued with vinculin wt, vinculin Y822F (non-phosphorylatable), vinculin Y822E (phosphomimetic) fusion constructs to demonstrate their localization at native adherens junctions. Cells were co-transfected with ZO1 constructs. Scale bar: 10 μm. e, Fuorescence intensity line profiles along the lines ( white) in d, showing co-localization of vinculin (red) with ZO-1 (green) at the cell-cell junctions. f, Diagram of vinculin conformational regulation by tension and Y822 phosphorylation, and a putative positive feedback loop. g, Schematic models of protein organization in cadherin-based adhesions, with stratified compartments along the vertical axis at empirically determined z-positions, for MDCK E-cadherin-based adhesions (left, with compact vinculin) and C2C12 N-cadherin-based adhesions (right, with extended vinculin). Note that the model does not depict protein stoichiometry.

