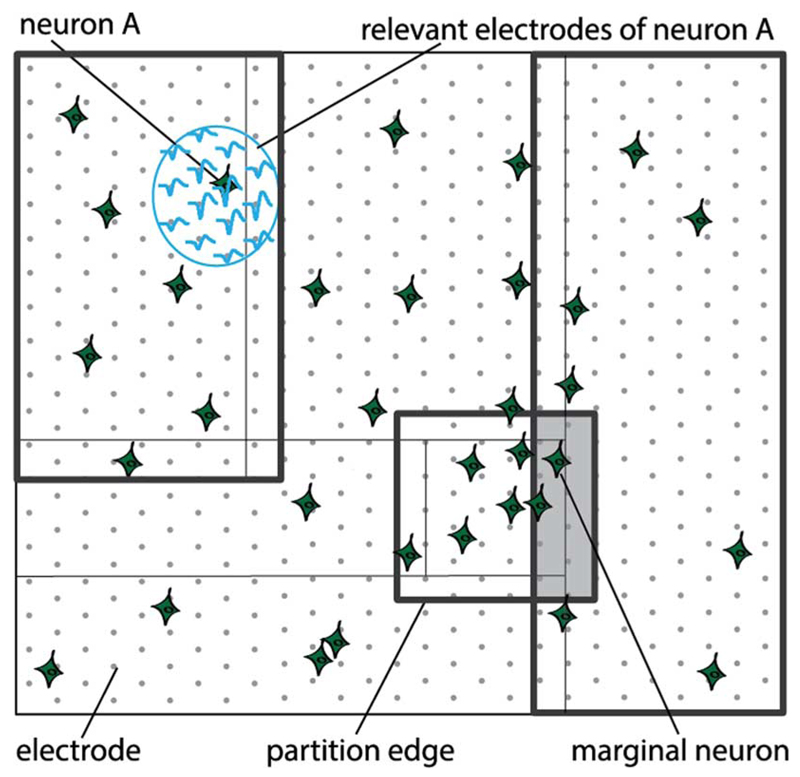
Fig. 3.
Illustration of a partitioned electrode set. For clarity, not all partitions are shown. Partitions are limited by thick lines; thin lines mark the provisional partitions. Partitions are different in size, resulting from the nonuniform spatial distribution of neurons. Marginal zone is depicted by a grey rectangle. Lightblue ellipse encompasses relevant electrodes for a given neuron.

