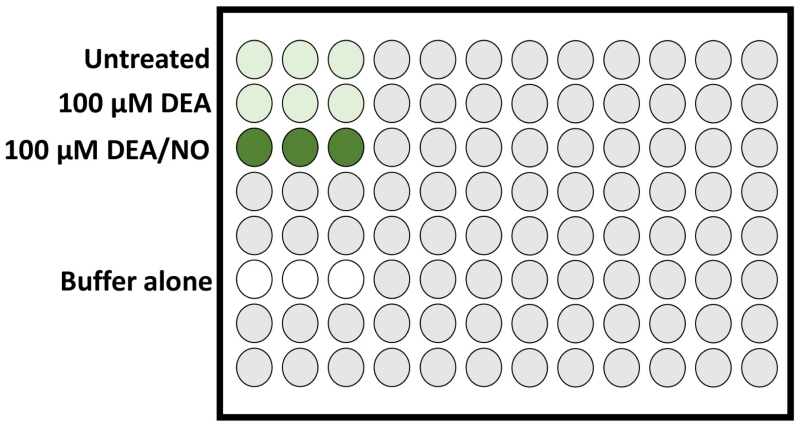
Figure 1. Schematic of DAF-FM stained cell samples loaded in triplicate in a 96-well plate (Step 26).
In this example experiment, higher-level DAF-FM fluorescence is expected in the positive control cell sample treated with DEA/NO (chemical NO donor; dark green wells), whereas detection of endogenous intracellular NO/RNS by DAF-FM fluorescence in the DEA treated and untreated samples (light green wells) are expected to be similar to each other, and both lower than the NO-treated positive control sample. Buffer alone (no DAF-FM stain present; white wells) should have very low levels of auto-fluorescence relative to the DAF-FM stained cells samples.

