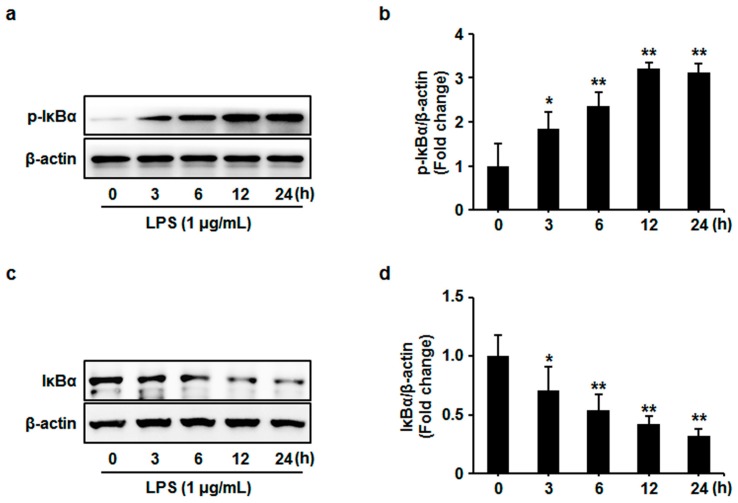
Figure 2.
HUVECs were stimulated with LPS (1 μg/mL) for the indicated time. (a) Cell lysates were prepared and subjected to western blotting. Phosphorylation (p) of IκBα was examined and representative images of three independent experiments are shown. (b) The ratio of phosphorylated IκBα immunopositivity to β-actin was calculated. The results are expressed as mean ± s.d. of three independent experiments. ** p < 0.05 vs. untreated control, ** p < 0.01 vs. untreated control. (c) Cell lysates were prepared and subjected to western blotting. Expression of IκBα was examined and representative images of three independent experiments are shown. (d) The ratio of IκBα immunopositivity to β-actin was calculated. The results are expressed as mean ± s.d. of three independent experiments. * p < 0.05 vs. untreated control, ** p < 0.01 vs. untreated control.

