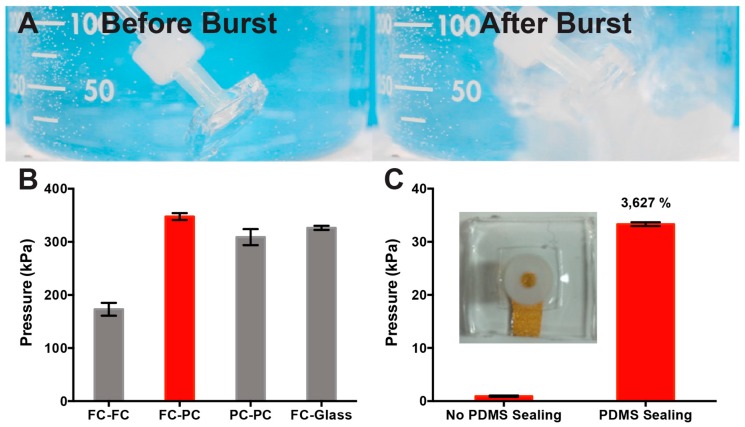
Figure 3.
PDMS bonding strength characterization All PDMS curing was done in a 60 °C oven with the following curing times as follows: fully cured (FC)—40 min; partially cured (PC)—20 min. (A) Image of the burst pressure test with the intact dead-end μF device (left) and the broken device (right). (B) Quantification of the burst pressure for different bonding combinations of FC–FC PDMS layers, PC–FC PDMS layers, PC–PC PDMS layers, and FC PDMS layer-glass. (C) Quantification of the burst pressure for a dead-end μF device with a 5 mm Au electrode in place. Graph compares devices without PDMS sealing around the device vs. with PDMS sealing after bonding. The inset shows a sample image of the dead-end burst pressure device with the Au electrode in place as would be seen in the μF device. All error bars represent the standard error of the mean, n = 3.

