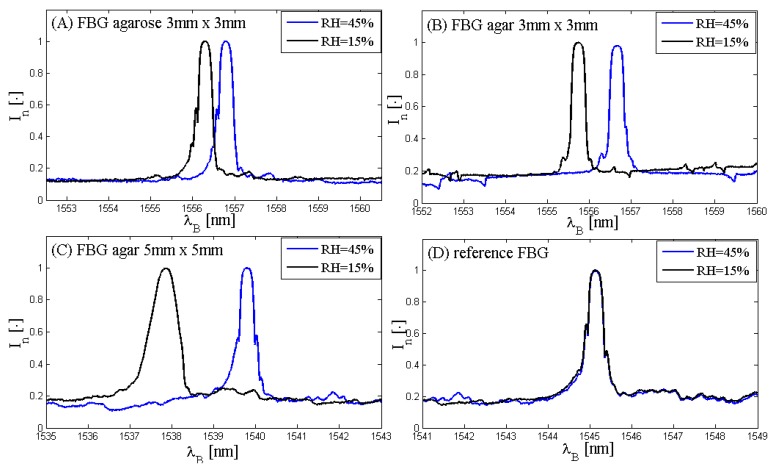
Figure 3.
Spectra of the three fiber Bragg grating (FBG)-coated sensors and of the reference FBG sensor at different RH values: (A) spectra of the agarose 3 mm × 3 mm-coated FBG at RH = 15% (black line) and RH = 45% (blue line); (B) spectra of the agar 3 mm × 3 mm-coated FBG at RH = 15% (black line) and RH = 45% (blue line); (C) spectra of the agar 5 mm × 5 mm-coated FBG at RH = 15% (black line) and RH = 45% (blue line); (D) spectra of the reference FBG at RH = 15% (black line) and RH = 45% (blue line).

