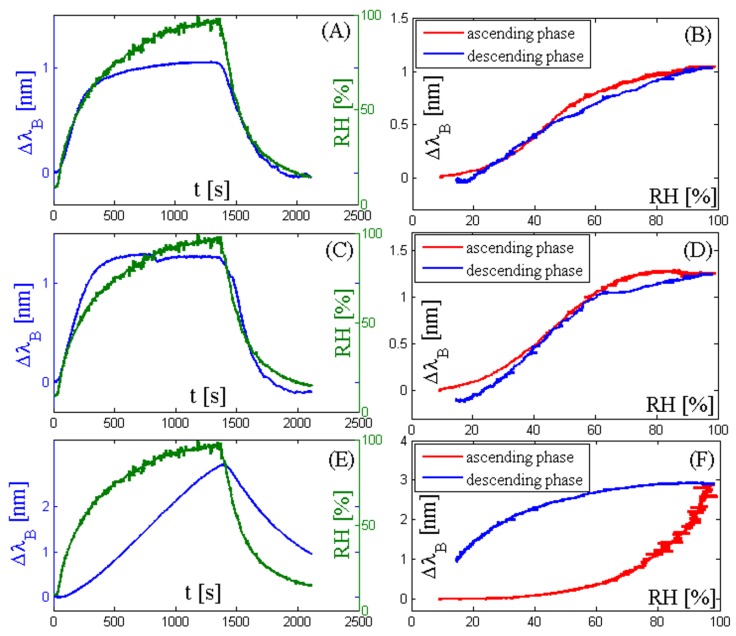
Figure 4.
(A) RH trend during the cycle (green line) and corresponding Bragg wavelength shift of the sensor output (blue line) coated by agarose (3 mm × 3 mm); (B) Bragg wavelength shift of the sensor output coated by agarose (3 mm × 3 mm) vs. the RH values during both the ascending phase (red line) and descending phase (blue line); (C) RH trend during the cycle (green line) and corresponding Bragg wavelength shift of the sensor output (blue line) coated by agar (3 mm × 3 mm); (D) Bragg wavelength shift of the sensor output coated by agar (3 mm × 3 mm) vs. the RH values during both the ascending phase (red line) and descending phase (blue line); (E) RH trend during the cycle (green line) and corresponding Bragg wavelength shift of the sensor output (blue line) coated by agar (5 mm × 5 mm); (F) Bragg wavelength shift of the sensor output coated by agar (5 mm × 5 mm) vs. the RH values during both the ascending phase (red line) and descending phase (blue line).

