
Figure 3.
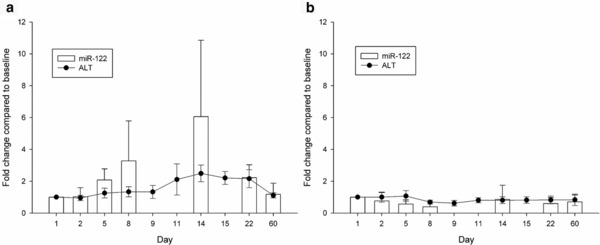
Time courses depicting the serum miR‐122 and ALT fold changes in the (a) Responder and (b) Nonresponder groups. The data represent the mean ± standard deviation.
Official websites use .gov
A
.gov website belongs to an official
government organization in the United States.
Secure .gov websites use HTTPS
A lock (
) or https:// means you've safely
connected to the .gov website. Share sensitive
information only on official, secure websites.
Time courses depicting the serum miR‐122 and ALT fold changes in the (a) Responder and (b) Nonresponder groups. The data represent the mean ± standard deviation.