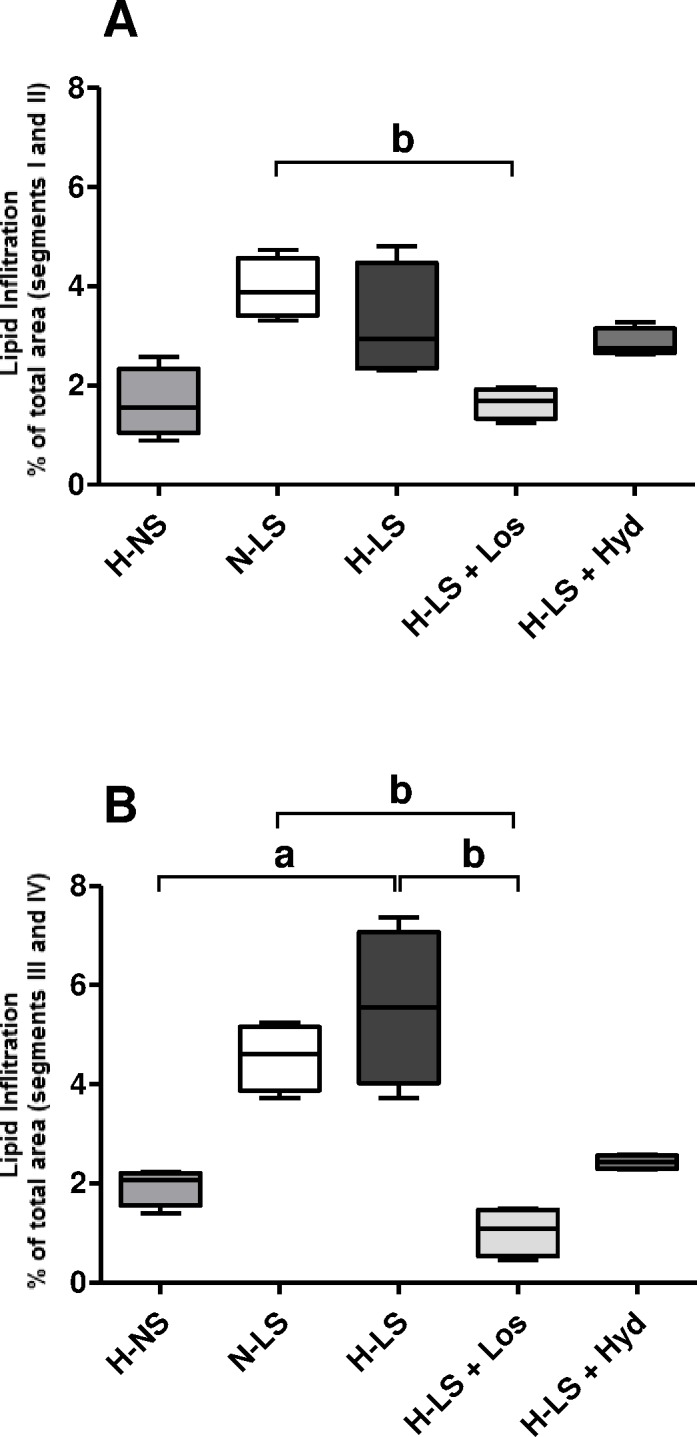
Fig 2.

Vascular injury quantified by a histomorphometric analysis of oil red O-stained lipid infiltration as the mean percentage of total positively stained area of the aortic arch cross-sections (A segments I and II; B segments III and IV); n = 4 mice per group. a P < 0.05, hypertensive mice fed a normal-sodium diet (H-NS) vs hypertensive mice fed a low-sodium diet (H-LS), Mann Whitney test. b P < 0.05, Kruskal Wallis with Dunn’s post hoc test applied for comparisons among LS groups.
