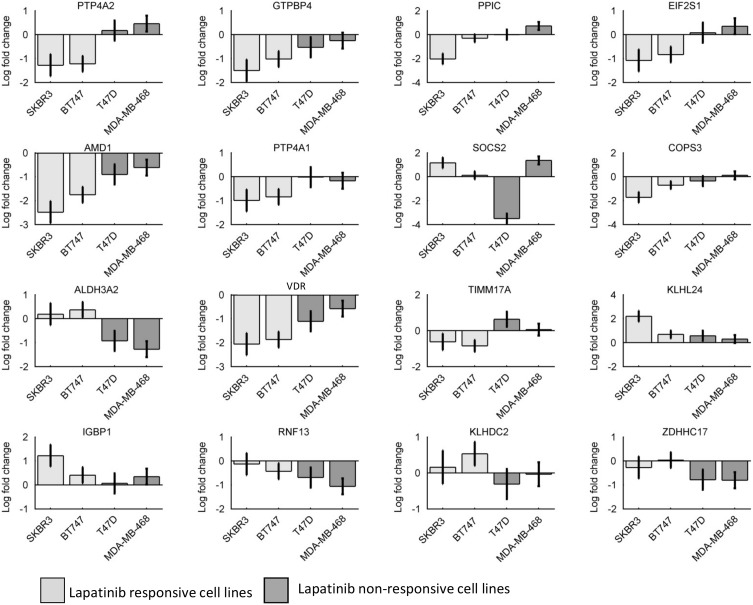
Fig 3. Real time qPCR based validation of a set of selected potential biomarkers.
Each panel consists of the log fold changes (lapatinib treated vs untreated, shown in Y-axis) of the corresponding gene (shown in the header of each panel) in all four cell lines (X-axis). Plots are based on N = 3 biological replicates.

