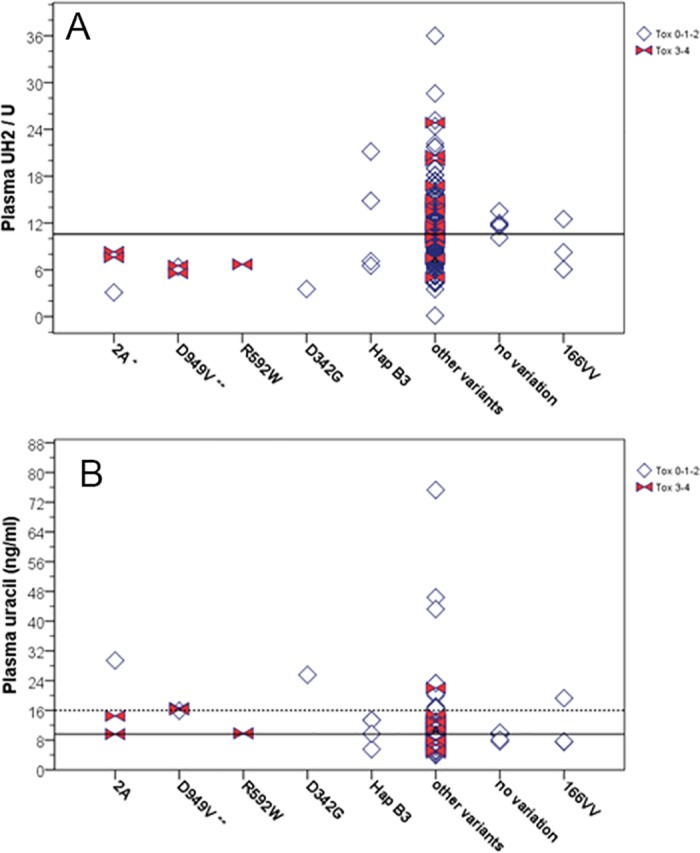
Fig 3.

Distribution of pre-treatment plasma UH2/U ratio (A) and Uracil concentrations (B) for the 205 patients with validated phenotypic data, according to DPYD variants of interest: variant *2A (3 heterozygous patients), D949V (3 heterozygous patients), R592W (1 heterozygous patient), D342G (1 heterozygous patient), HapB3 (4 heterozygous patients), 166VV (3 homozygous patients) vs any other variations (185 patients) vs no variation (5 patients). DPD deficiency is reflected by plasma UH2/U decrease or plasma uracil increase. All indicated genotypes were mutually exclusive. Horizontal solid lines indicate median values (10.6 for UH2/U and 9.6 ng/ml for Uracil concentration). Horizontal dotted line on Uracil plot indicates the 91st percentile (16 ng/ml) associated with enhanced grade 3–4 toxicity. Open diamonds indicate patients with toxicity grade 0-1-2 and solid bow ties indicate patients with grade 3–4 toxicity. For variants carried by at least 3 patients, distribution of phenotype was compared between carriers and non-carriers using the non-parametric Mann-Whitney test (* indicates 0.01≤p<0.05 and ** indicates p<0.01).
