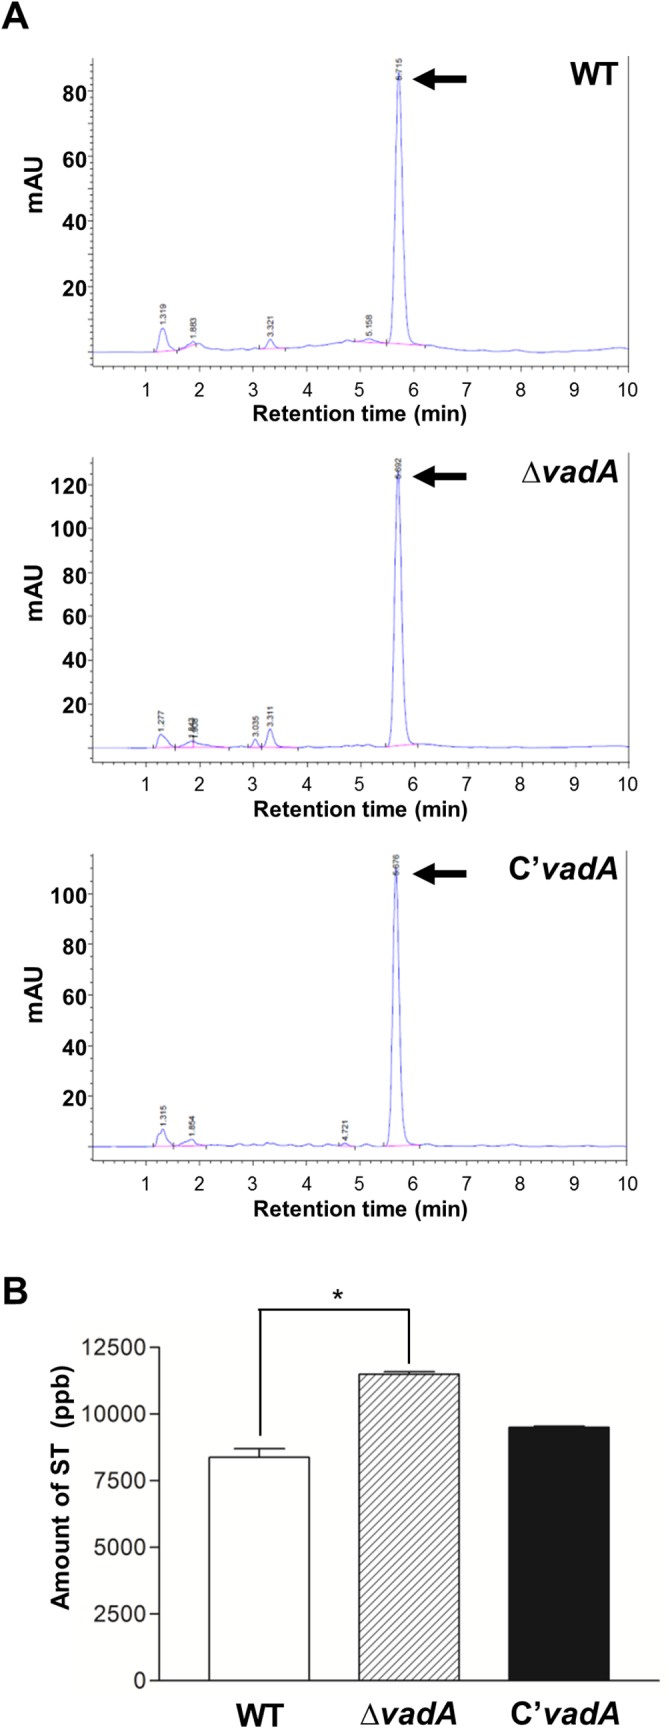
Fig 4. ST analysis.

(A) Determination of ST production by WT (FGSC4) (Top), ΔvadA (THS33.1) (Middle), and C’ (THS34.1) (Bottom) strains. The culture supernatant of each strain was extracted with chloroform and subjected to HPLC. Arrows indicate ST. (B) Amount of ST produced after seven days of stationary culture (CM) of WT (FGSC4), ΔvadA (THS33.1) and C’ (THS34.1) strains (measured in duplicate).
