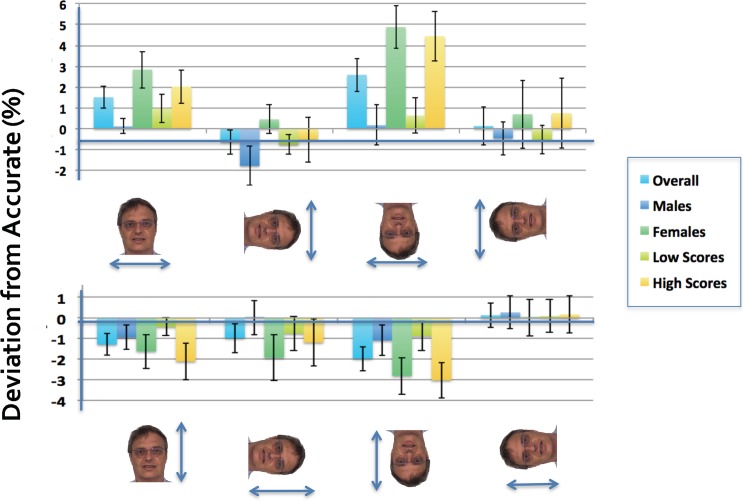
Fig 1. Deviation from accurate results when face width (top row) or face length (bottom row) was distorted for each viewing orientation.
Average percentages are shown across all between-subjects groups. Positive and negative scores represent overestimation and underestimation respectively. Error bars represent ±1 SEM. The individual in this figure has given written informed consent (as outlined in PLOS consent form) to publish these case details.

