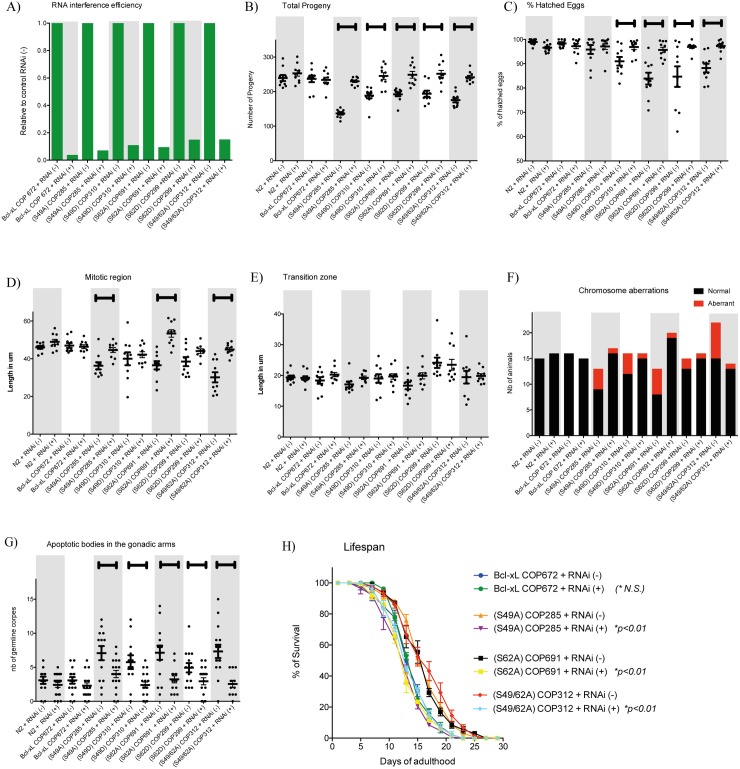
Fig 7. Effects of silencing the expression of BCL-XL variants in various transgenic strains and control worms.
A) RNAi efficiency, B) total viable progeny and C) percentages of eggs hatched, D) mitotic regions and E) transition zones, F) chromosome stability and aneuploidy, G) germline apoptosis of the gonads and H) lifespan. Each point in graph (B to G) represent data obtained from single worm. Bars are means ± s.d. Brackets on top of graph (B to G) indicate statistical significance with p<0.05 between worms subjected to control RNAi (-) and BCL-XL RNAi (+). Statistical significance for H) is indicated in graph legend. Typical micrographs are showed in S3 and S4 Figs.

