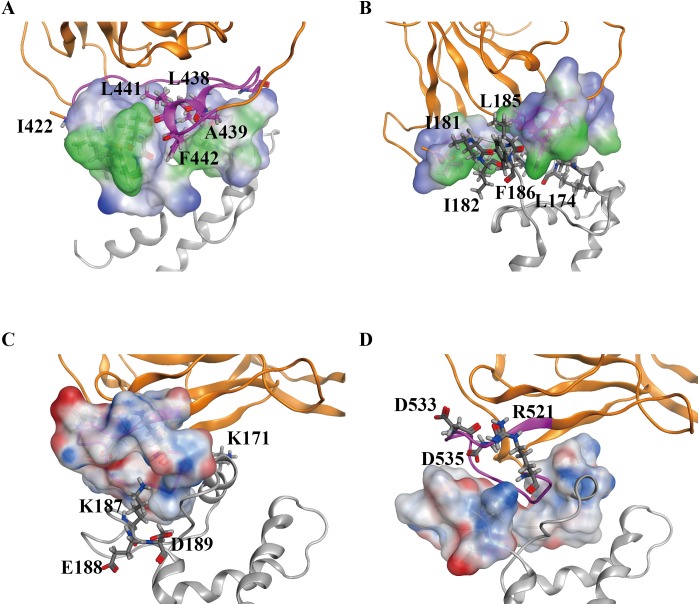
Fig 5. Surface charge and lipophilicity distributions for HCV E2 binding to human CD81.
The complex structure is presented as a ribbon (orange: HCV E2; gray: human CD81). (A) and (B) are the surface lipophilicity distributions on HCV E2-site1 and human CD81 at the binding interface. In the figures, blue represents the hydrophilic part and green the hydrophobic part. The hydrophobic residues around the binding interface are labelled and presented as sticks. (C) and (D) are the surface charge distributions on HCV E2-site2 and human CD81 at the binding interface mapped according to the Poisson-Boltzmann equation. Blue and red correspond to positive and negative electrostatic potential, respectively. Charged residues around the binding interface are labelled and presented as sticks.

