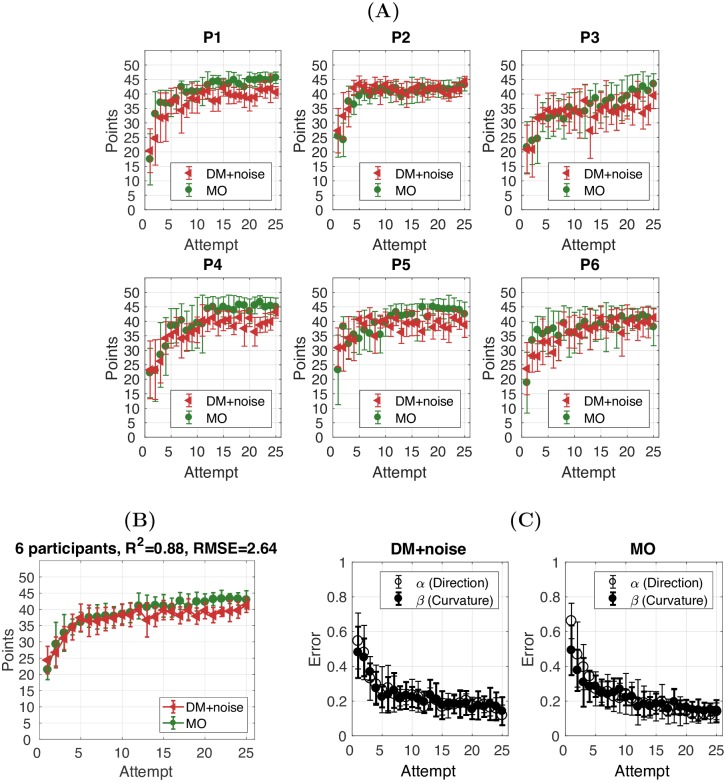
Fig 10. Experiment 2: Decision-making with motor noise.
(A) Learning curves for the DM+noise (red) and MO (green) tasks for each participant. The R2 between the DM+noise and MO task is provided. (B) Average learning curves across 6 participants. (C) Error in α and β (y-axis) plotted against the number of attempts (x-axis) in the DM+noise and the MO task. Error bars in all panels represent 95%CI across participants.

