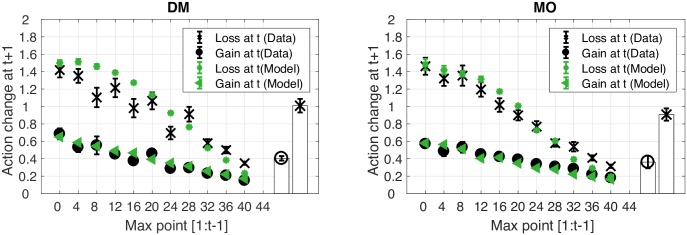
Fig 12. Action change relative to the current highest score (the reference point).
Action change on attempt t + 1 was plotted as a function of the maximum points achieved up to t − 1 (the reference point) for the DM task (left panel) and MO task (right panel). If the score on attempt t was greater than the reference point, then the action change at t + 1 was considered as an action after a gain (black circle). If the score on attempt t was smaller than the reference point, then the action change after this score (t + 1) was considered as an action after a loss (black cross). Model (green) predictions are also provided. The bars represent the mean action change in the DM task (left panel) and the MO task (right panel). Error bars represent 95% CI across participants.

