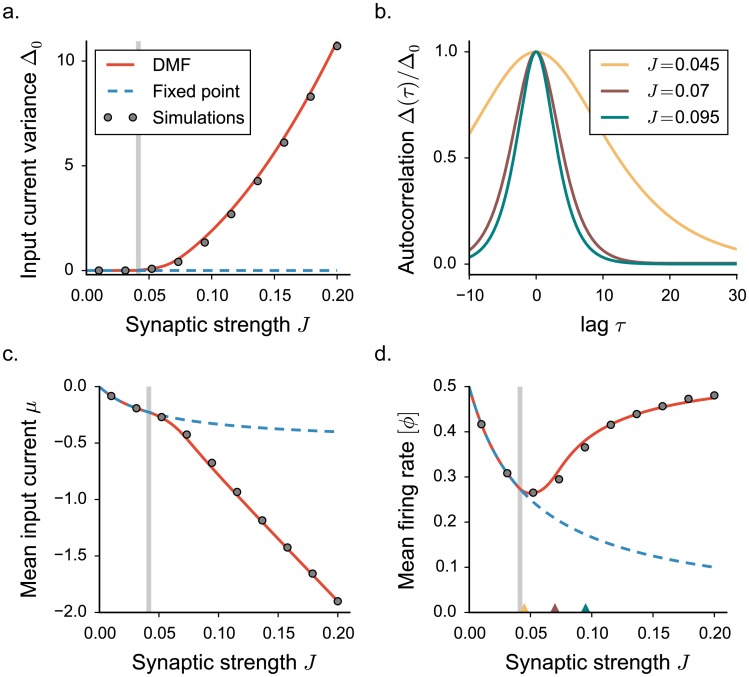
Fig 2. Statistical description of the network activity with a threshold-linear activation function.
The dynamics mean field results are shown in full lines, numerical simulations as points. a. Input current variance as a function of the synaptic coupling J. Vertical grey lines indicate the critical value JC. Grey points show time and population averages performed on 4 realizations of simulated networks, N = 7000. b. Normalized auto-correlation function for increasing values of the synaptic coupling (indicated by colored triangles in panel d). c-d. First order statistics: mean input current and mean firing rate. Choice of the parameters: g = 5, C = 100, ϕmax = 2.

