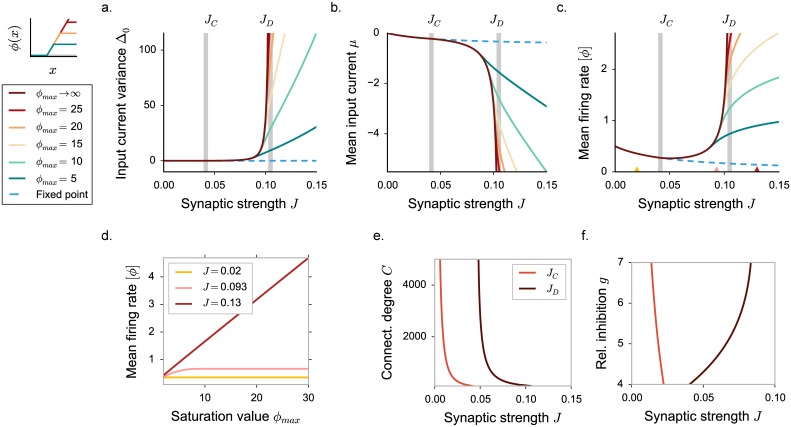
Fig 3. Appearance of three dynamical regimes in excitatory-inhibitory rate networks, dynamical mean field predictions.
Threshold-linear activation function saturating at different values of the upper bound ϕmax. a-b-c. DMF characterization of the statistics for different values of the saturation value ϕmax. In a, input current variance, in b, input current mean, in c, mean firing rate. Vertical grey lines indicate the critical couplings JC and JD. d. Mean firing rate dependence on the upper bound ϕmax, for three coupling values corresponding to the three different dynamical regimes (indicated by triangles in panel c). Dots show time and population averages performed on 4 realizations of simulated networks, N = 6000. Choice of the parameters: g = 5, C = 100. e-f. Phase diagram of the dynamics: dependence on the connectivity in-degree C and on the inhibition dominance parameter g. All other parameters are kept fixed.

