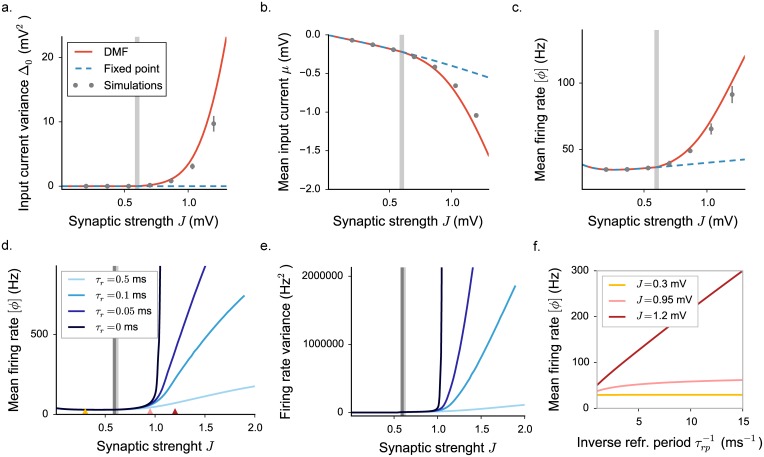
Fig 8. Dynamical mean field characterization of rate network activity with a LIF activation function, where we set , Hz.
a-b-c. Statistical characterization for τr = 0.5 ms: input variance, mean input current and mean firing rate. Grey vertical lines indicate the position of the critical coupling. Choice of the parameters: g = 5, C = 100. d-e. Mean firing rate and rate standard deviation for different values of the refractory period, determining slightly different positions of the transition (grey lines). Choice of the parameters: g = 5, C = 100, μ0 = 24 mV. f. Mean firing rate dependence on the refractory period, the inverse of which determines the saturation value of the transfer function. The three values of the synaptic coupling, indicated by triangles in c, correspond to the three different regimes.

