
Figure 6. Effect of fulvestrant and AZD4547 on in vivo A549 xenograft growth.
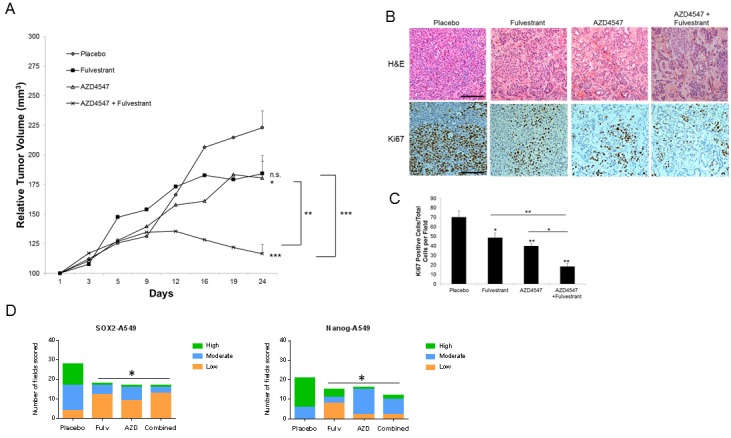
A549 tumor bearing mice received the following treatments for 24 days: placebo, fulvestrant (30mg/kg; s.c.; twice weekly), AZD4547 (12.5 mg/kg p.o.; daily), or combination. A. Tumor growth was measured twice weekly and results represent the relative mean tumor volume ± S.E. of 6-8 tumors per treatment group. ANOVA * = P < .05; ** = P < .01;*** = P < .001. B. Representative H&E and Ki67 labeling of different treatment groups from xenografts harvested at 24 days (scale bar = 150μm). C. Quantitation of Ki67 labeling. Positive cells were counted in 5 high-powered fields per tumor and represent 3 tumors per experimental treatment group. ANOVA ** = P < .01;*** = P < .001. D. Distribution of SOX2 and Nanog IHC scores. SOX2 and Nanog were scored on a scale of low ( < 30% of cells in the field were positive), moderate (30-60% of cells were positive) and high ( > 60% of cells were positive). The distribution of number of fields with each score was plotted in each treatment group. A Chi-square test was performed to determine if statistical differences were present across the treatment groups (P < 0.05), followed by individual Fisher's exact tests to determine which treatments were significantly different. SOX2, * P < 0.02; Nanog, * P < 0.002.