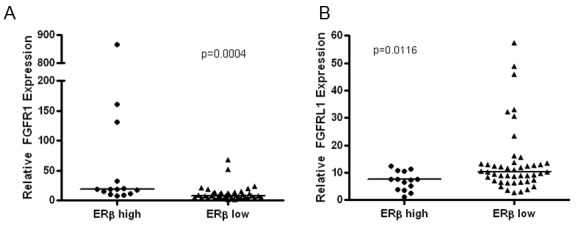
Figure 8. Quantitation of mRNA expression of FGFR1 and FGFRL1 (FGFR5) in NSCLC biospecimens that differ by ERβ status.

TaqMan qRT-PCR validation of FGFR1 and FGFRL1 expression in the ERβ high/low cohort. Line represents median values in each set and P-values were determined using the Mann-Whitney test.
