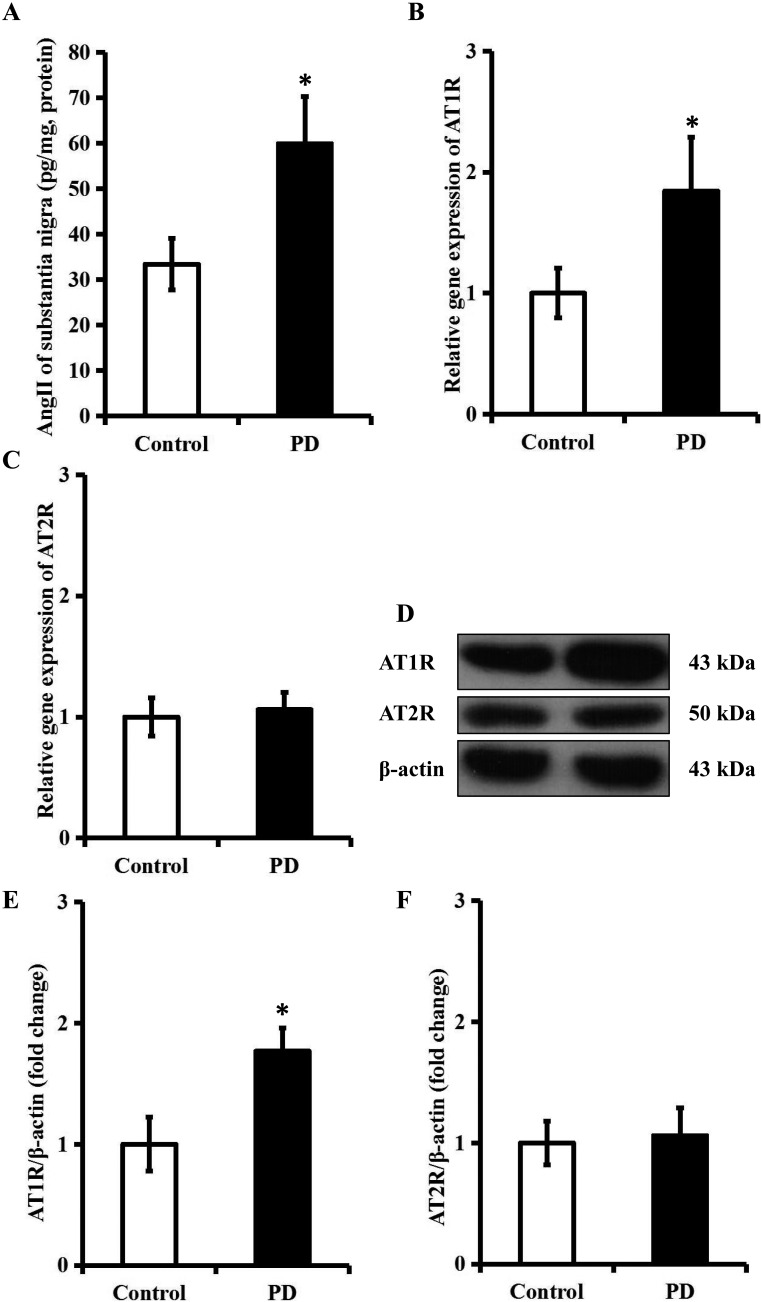
Figure 3. Ang II/AT1R axis is upregulated in the SN of a rat model of PD.
The rat model of PD was established using a four-week infusion of rotenone (2.5 mg/kg/d). A. The level of Ang II in the SN in the control and PD group. B. and C. The mRNA level of AT1R and AT2R in the SN in control and PD group. D.-F. The protein level of AT1R and AT2R in the SN in control and PD group. n = 6 per group. Data were analyzed by independent samples t test. Columns represent mean±SD. *P < 0.05 vs. control group.

