
Figure 1. High glucose (HG) induced apoptosis in HK2 cells.
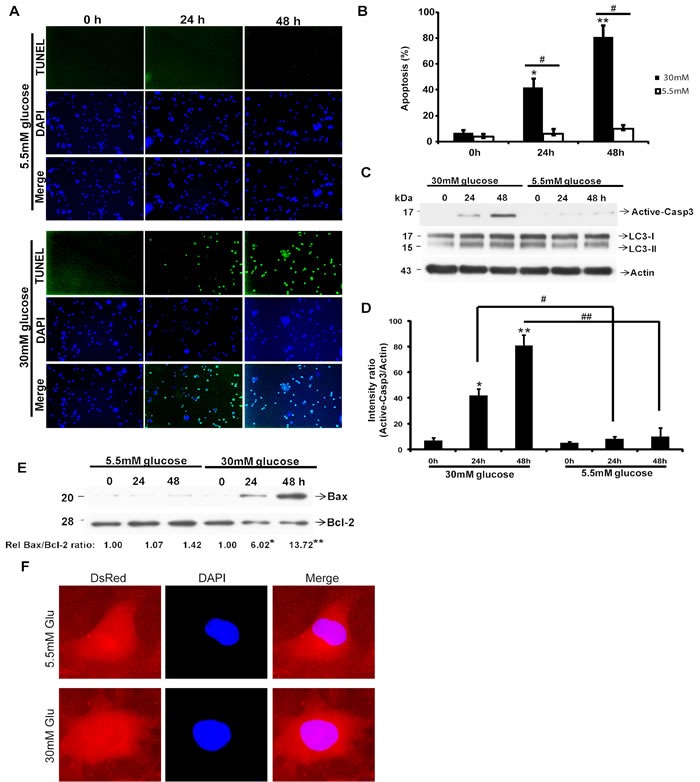
HK2 cells were treated with 30mM or 5.5mM glucose for indicated times. A. Apoptosis was determined by TUNEL staining (green dots) and doubly stained with DAPI (blue dots). B. The percent of cell death was quantified by dividing the number of apoptotic nuclei to a population of 1,000 counted cells per condition. Graphs represent means ± s.e.m. n = 3; *P < 0.05, **P < 0.01, relative to the 0h group; one-way ANOVA.#p < 0.05, relative to 5.5mM group; Student's t test. C. Imunobloting analysis of Caspase3, LC3 and Actin. D. Active-Caspase3/Actin immunoreactivityintensity is quantitated by densitometric analysis, and optical density values are expressed as a ratiobetween the Active-Caspase3 and Actin. Data shown are the mean ± s.e.m. n = 3. *P < 0.05, **P < 0.01, relative to the 0h group; one-way ANOVA. #p < 0.05, ##p < 0.01; relative to 5.5mM group; Student's t test. E. Protein levels of BAX and BCL-2 were examined by immunoblotting. Quantification of the expressionratio of BAX/BCL-2 is shown with the ratio of 1.0 being assigned to 5.5mM-0h cells. *P < 0.05, **P < 0.01, one-way ANOVA. F, Representative images of HK2 cells transfected with Dsred-LC3-GFP for 48 h. after treated with 5.5 mM or 30mM glucose, cells were fixed followed by microscopy.