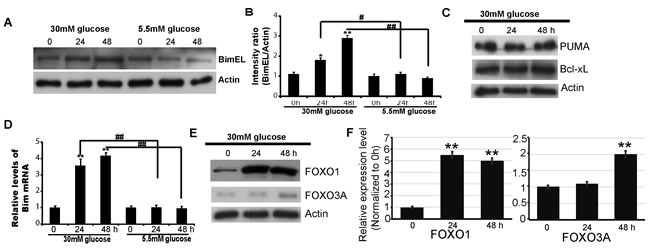
Figure 2. Bim expression is increased by High glucose treatmentin HK2 cells.

HK2 cells werepretreated with 30mM or 5.5mM glucose for indicated times. A. up: Imunobloting analysis of Bim and Actin (The protein are from the same sample of Fig1c). down: BimEL/Actin immunoreactivityintensity is quantitated by densitometric analysis, and optical density values are expressed as a ratiobetween the BimEL and Actin. Data shown are the mean ± s.e.m. n = 3. *P < 0.05, **P < 0.01, relative to the 0h group; one-way ANOVA. #p < 0.05. B. Imunobloting analysis of Bim and Actin in HK2 cells treated with 30mM glucose. C. Imunobloting analysis of PUMA, Bcl-xL and Actin in HK2 cells treated with 30mM glucose. D. Relative mRNA levels of Bim in HK2cells analyzed byreal-time RT-PCR. Data are shown as the mean ± s.e.m. n = 3; *P < 0.05, **P < 0.01,compared with0 h group; Student's t-test. ##p < 0.01; relative to 5.5mM group; Student's t test. E. Imunobloting analysis of FOXO1, FOXO3a and Actin in HK2 cells treated with 30mM glucose. F. Quantification of the relative (rel.) levels of FOXO1 and FOXO3A; Data were shown as the mean ± s.e.m. n = 3; **P < 0.01, compared with 0 h group; one-way ANOVA.
