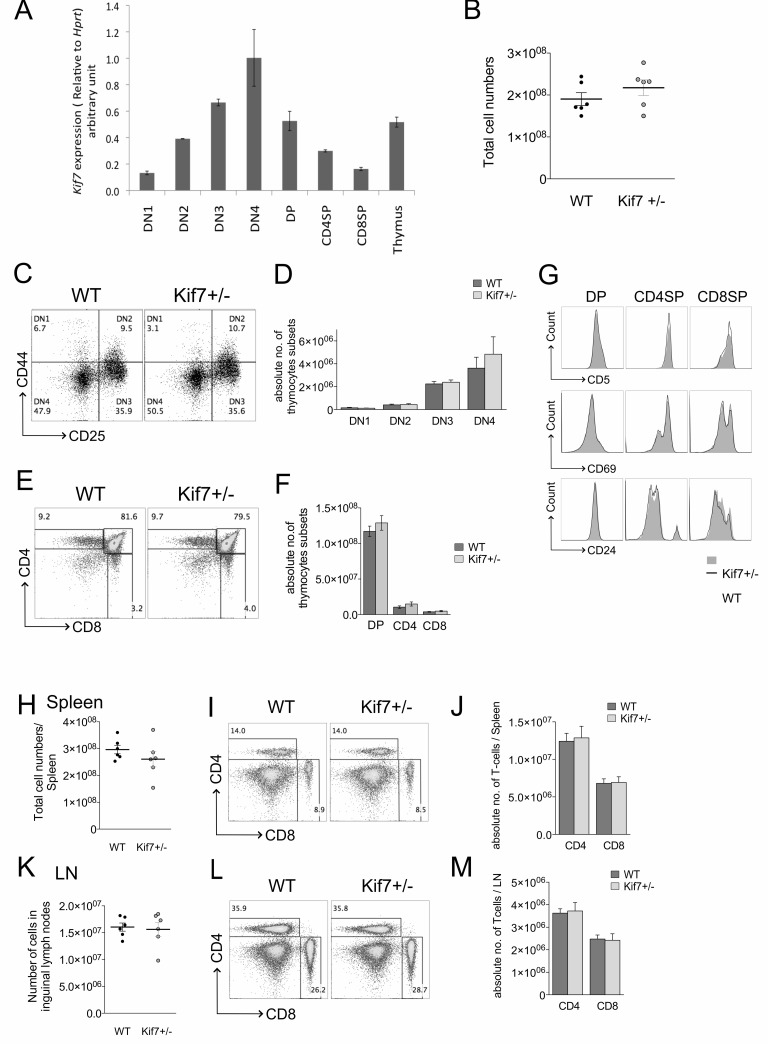
Figure 1. Thymocytes develop normally in Kif7+/− mice.
In all bar charts in this figure, error bars show the standard error of the mean (SEM). A. Bar chart shows Kif7 transcript levels in FACS sorted DN, DP, SP thymocytes and the whole thymus assessed by quantitative RT-PCR. The expression levels were normalized against Hprt. B.-G. Analysis of developing thymocytes, isolated from WT (n = 6) and Kif7+/− (n = 6) mice at 6-8 weeks old. B. Scatter plot: number of cells in the thymus. Each data point represents a single mouse. The mean for each group is indicated with a line. C. Dot plots: flow cytometry profiles of DN subpopulations (DN1-DN4) by surface expression of CD44 and CD25 gated on CD4-CD8- cells. D. Mean number of cells in DN1-DN4 subsets in WT and Kif7+/− is shown in bar chart. Percentages of thymocyte subsets (mean+/−SEM): DN1, WT: 2.74+/−0.83 KO:1.75+/−0.34; DN2, WT: 7.46+/−1.72 KO:7.11+/−2.4; DN3, WT: 36.6+/−2.67 KO:34.2+/−3.68; DN4, WT: 53.2+/−4.3 KO:56.9+/−5.65. There were no significant differences in the percentage of thymocyte subsets. E. Dot plots: flow cytometry of anti-CD4 and anti-CD8 staining on Kif7+/− and WT thymus, giving percentage of DP, CD4SP, CD8SP cells. F. Mean number of cells in DP, CD4SP and CD8SP populations in WT and Kif7+/− thymus is shown in bar chart. Percentages of DP, CD4SP and CD8SP populations (mean+/−SEM): DP, WT: 84.1+/−1.09 KO:81.2+/−0.98; CD4SP, WT: 6.61+/−0.76 KO:8.02+/−0.54; CD8SP, WT: 2.54+/−0.27 KO:2.81+/−0.38. There were no significant differences in the percentage of T-cell populations. G. Histograms show cell surface anti-CD5 (upper panel), anti-CD69 (middle panel) and anti-CD24 (lower panel) staining, gated on DP, CD4SP and CD8SP populations in WT and Kif7+/− thymus. H.-J. Analysis of T-cells in spleen, isolated from WT (n = 6) and Kif7+/− (n = 6) mice at 6-8 weeks old. H. Scatter plot: number of cells in the spleen. Each data point represents a single mouse. The mean for each group is indicated with a line. I. Dot plots: flow cytometry of anti-CD4 and anti-CD8 staining on Kif7+/− and WT spleen, giving percentage of CD4 T-cells and CD8 T-cells. J. Mean number of cells in CD4 and CD8 T-cell populations in WT and Kif7+/− spleen is shown in bar chart. Percentages of CD4 and CD8 T-cell populations (mean+/−SEM): CD4 T-cell, WT: 14.2+/−1.29 KO:15.2+/−0.79; CD8 T-cell, WT: 7.7+/−0.60 KO:8.19+/−0.45 There were no significant differences in the percentage of T-cell populations. K. Scatter plot: number of cells in the two inguinal lymph nodes. Each data point represents a single mouse. The mean for each group is indicated with a line. L. Dot plots: flow cytometry of anti-CD4 and anti-CD8 staining on Kif7+/− and WT lymph node, giving percentage of CD4 T-cells and CD8 T-cells. M. Mean number of cells in CD4 and CD8 T-cell populations in WT and Kif7+/− LN is shown in bar chart. Percentages of CD4 and CD8 T-cell populations (mean+/−SEM): CD4 T-cell, WT: 37.9+/−1.40 KO:39.6+/−1.51; CD8 T-cell, WT: 25.6+/−0.85 KO:25.4+/−0.63. There were no significant differences in the percentage of T-cell populations.

