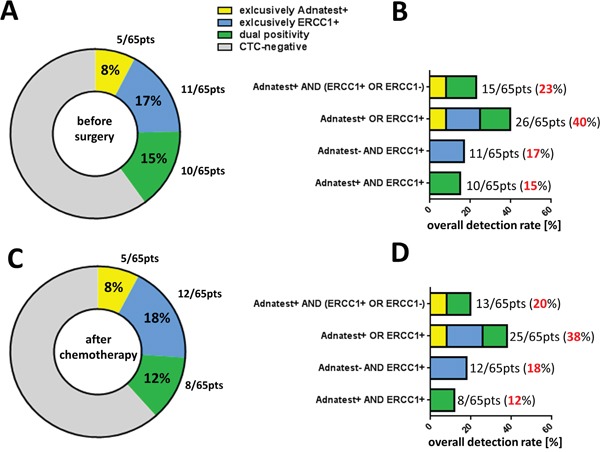
Figure 1. Influence of auxiliary ERCC1-transcript assessment on CTC-detection rate.

A. The pie chart shows the different CTC-types and their relative proportions among the studied ovarian cancer patients before surgery (n=65). Percentages indicate the proportion of patients with exclusively-Adnatest-positivity (yellow), exclusively-ERCC1-positivity (blue), dual-positivity for Adnatest/ERCC1 (green) and CTC-negative patients (grey). B. The stacked bar chart summarizes four CTC-definition criteria, considering ERCC1 as additional transcript marker and shows, how this is translated into different overall CTC-detection rates. C+D. These illustrations depict the same type of analysis as reported above, however refer to paired blood samples analyzed after platinum-based chemotherapy (n=65). In all figures, absolute patient numbers in each subgroup are indicated.
