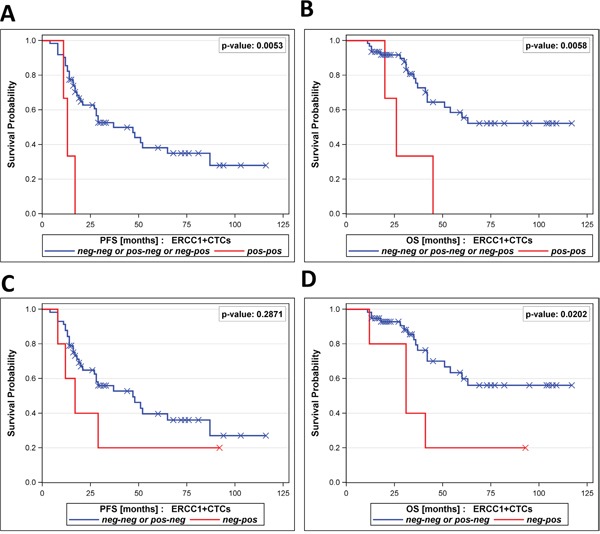
Figure 4. Prognostic relevance of persistent ERCC1+CTCs.

The Kaplan-Meier plots show A. progression-free survival and B. overall survival of patients with persistent positivity for ERCC1+CTCs in their blood (ERCC1+CTC pos-pos, bottom curves), in comparison to all other dynamic subgroups together (ERCC1+CTC pos-neg / neg-pos / neg-neg, top curves). Moreover, Kaplan-Meier plots show C. progression-free survival and D. overall survival of patients with newly acquired positivity for ERCC1+CTCs (ERCC1+CTC neg-pos, bottom curves), in comparison to the dynamic subgroups ERCC1+CTC pos-neg and ERCC1+CTC neg-neg, together (top curves).
