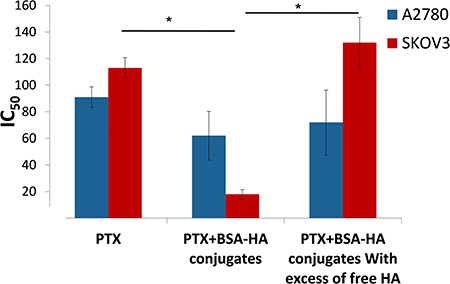
Figure 13. IC50 of PTX and that of PTX encapsulated within BSA-HA conjugates, for SKOV3 cells and A2780 cells with or without the addition of excess free HA.

Molar ratio of free HA to conjugated HA was 100:1; * denotes a P-value lower than 0.05.

Molar ratio of free HA to conjugated HA was 100:1; * denotes a P-value lower than 0.05.