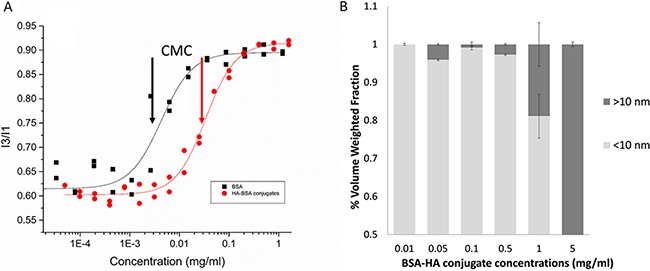
Figure 2.

(A) Pyrene fluorescence I3:I1 ratio (386 and 374 nm, respectively) vs. BSA and BSA-HA conjugates concentration. [Pyrene] = 1.02 μM; excitation wavelength: 338 nm. The lines were obtained by model fitting based on Equations 1 and 2. Arrows represent the CMC: CMC (BSA) = (0.0041 ± 0.0008) mg/ml; CMC (HA-BSA conjugates) = (0.033 ± 0.002) mg/ml; (B) Volume weighted size distributions as a function of BSA-HA conjugates concentration.
