
Figure 7.
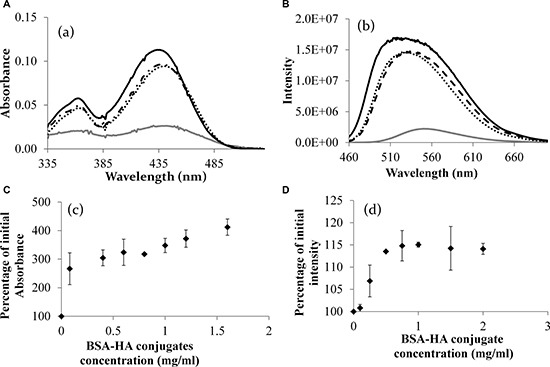
(A) The absorbance spectrum of C-1375 in different solvents. (B) Fluorescence intensity of pure C-1375 in different solvents (excitation: 435 nm). Methanol (solid black line), ethanol (dotted line), acetonitrile (dashed line), and water (gray line). (C) The percentage of the initial absorbance at 444 nm of pure C-1375 as a function of the concentration of the BSA-HA conjugate. (D) The percentage of the initial intensity of pure C-1375 vs. the concentration of the BSA-HA conjugate. [C-1375] = 15 μM.