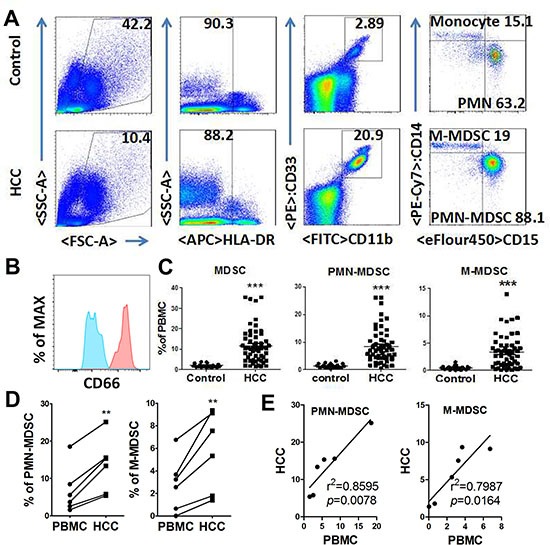
Figure 1. Expansion of PMN-MDSC and M-MDSC in HCC patients.

(A) Gating strategy of PMN-MDSC/M-MDSC by flow cytometry analysis. PMN-MDSC was defined as HLA-DR−/lowCD11b+CD33+CD14−CD15+, with M-MDSC defined as HLA-DR−/low CD11b+CD33+CD14+CD15−. (B) CD66 expression in PMN-MDSCs (red) and M-MDSC (blue). (C) Statistical analysis of PMN-MDSC and M-MDSC frequency in the peripheral blood from HCC patients and healthy controls. (D) Comparison of PMN-MDSC/M-MDSC level in PBMC and tumor tissue. (E) Association of PMN-MDSC/M-MDSC level in PBMC and tumor tissue by Linear regression. **P < 0.01; ***P < 0.001.
