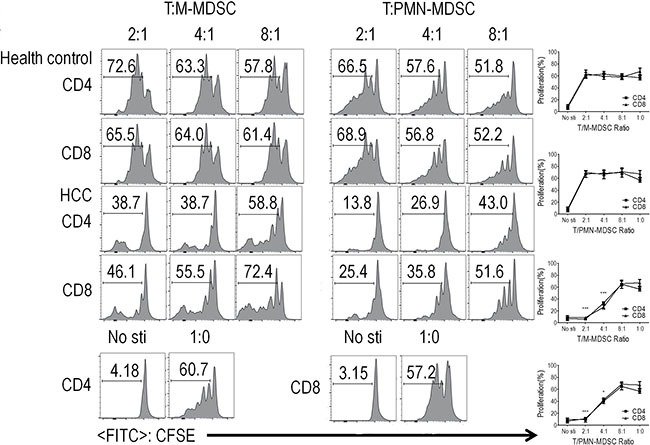
Figure 2. PMN-MDSC and M-MDSC from HCC patients and health donor suppressed T cell proliferation and activation.

CD3+ T cells from PBMCs were stimulated with anti-CD3 and anti-CD28, co-cultured with PMN-MDSCs/M-MDSC from the same donors at different ratios for 3 days, and evaluated for CD4+ and CD8+ T cell proliferation by CFSE labeling. Left panels: Representative flow cytometry data from 1 individual. Right panels: Cumulative data. Bottom: Representative flow cytometry data of positive control and negative control. (n = 5). *P < 0.05; ***P < 0.001.
