
Figure 3. External calibration of the nomogram.
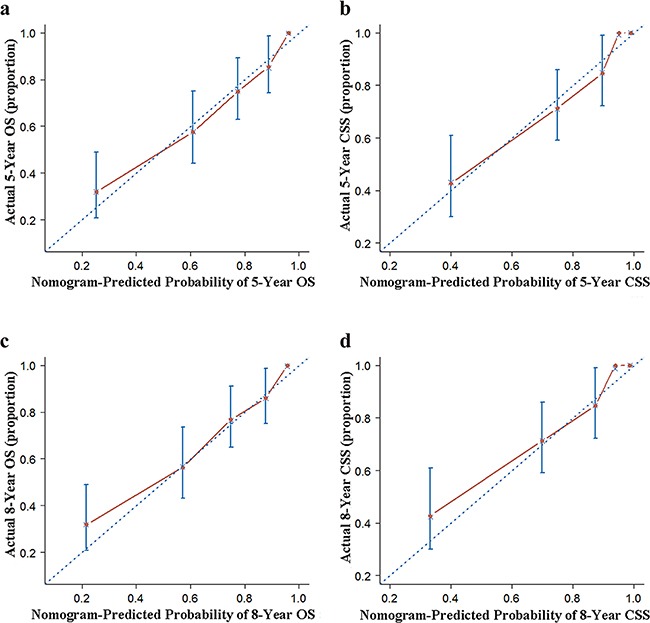
a. 5- and c. 8-year overall survival (OS) nomogram calibration curves; b. 5- and d. 8-year cancer-specific survival (CSS) nomogram calibration curves. The dotted line represents the ideal match between the nomogram-predicted (X-axis) and actual survival (Y-axis). Vertical bars indicate 95% confidence intervals.