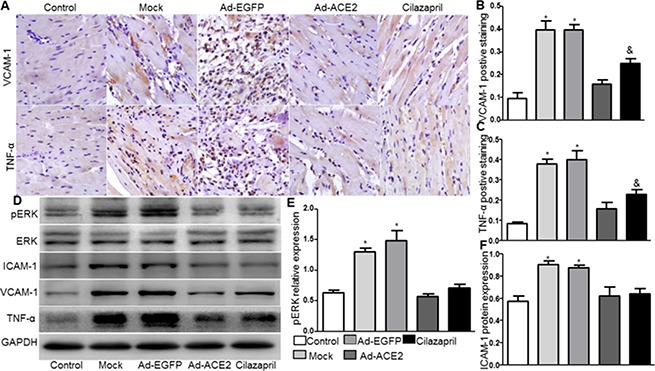
Figure 4. VCAM-1, TNF-α, ICAM-1 and ERK protein expression in five groups of rats 4 weeks after gene transfer.

(A) IHC analysis of VCAM-1 and TNF-α of myocardium cross-section from each group and (B and C) quantitative analysis of the results in A. Scale bar: 20 μm. (D) The levels of ERK, ICAM-1, VCAM-1 and TNF-α protein in myocardium were determined by Western blot and (E and F) quantitative analysis of ERK and ICAM-1 protein in D. The blot is a representative of three blots from three independent experiments. N is 8–15 in each group. *P < 0.05 vs. Control, Ad-ACE2 and Cilazapril;&P < 0.05 vs. Ad-ACE2.
