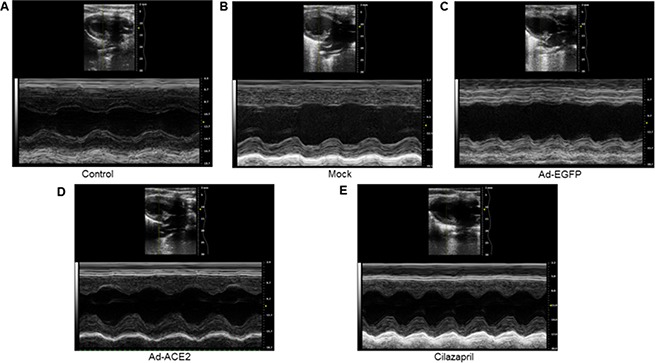
Figure 6. Cardiac function data in five groups of rats 4 weeks after gene transfer.

Representative echocardiographic graphs in 2D parasternal long axis view and M-mode of the left ventricle (LV) at the level of the papillary muscles. N is 8–15 in each group.
