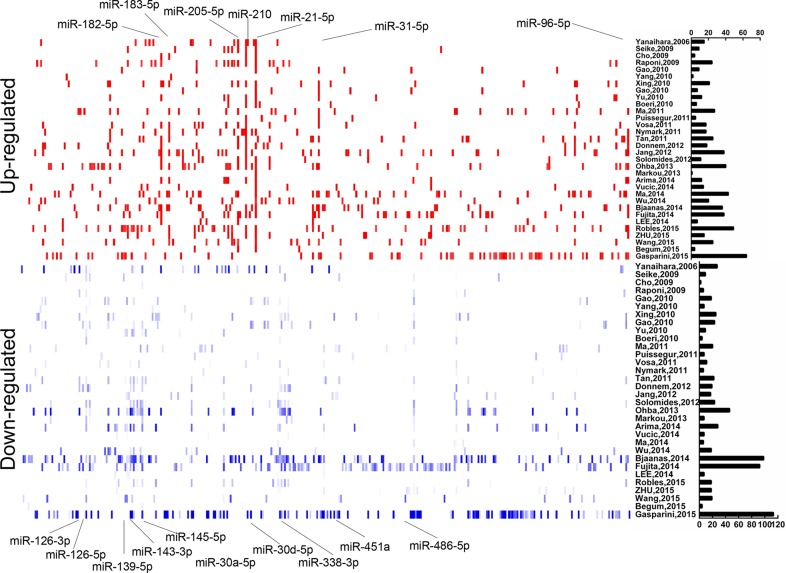
Figure 1. Distribution of NSCLC differentially dysregulated miRNAs extracted from 32 miRNA profiles studies.
Upregulated and downregulated miRNAs were shown as short red and blue vertical bars, respectively. The number of miRNAs in each study is graphically depicted on the right. The positions of NSCLC integrated-signature miRNAs were marked.

