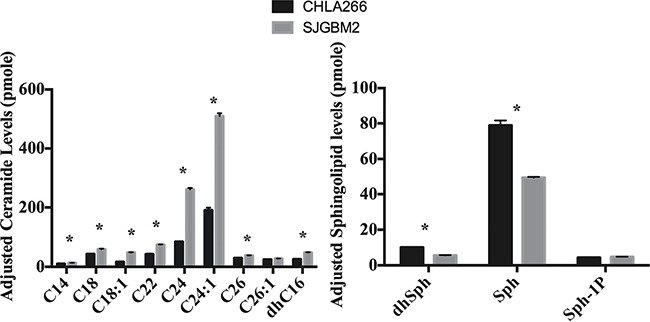
Figure 5. A high level of ASAH1 is associated with a lower level of its substrates and a higher level of its endproducts, ceramides and sphingosines, respectively.

Cell pellets were prepared and lipids were extracted for mass spectrometry as described in Materials and Methods. Intracellular ceramide and sphingolipid levels are from CHLA266 (black bars) and SJGBM2 (gray bars) cells. These levels were adjusted for equal loading based on the phosphate level. Results shown are mean ± SD of three replicates. *P < 0.05.
