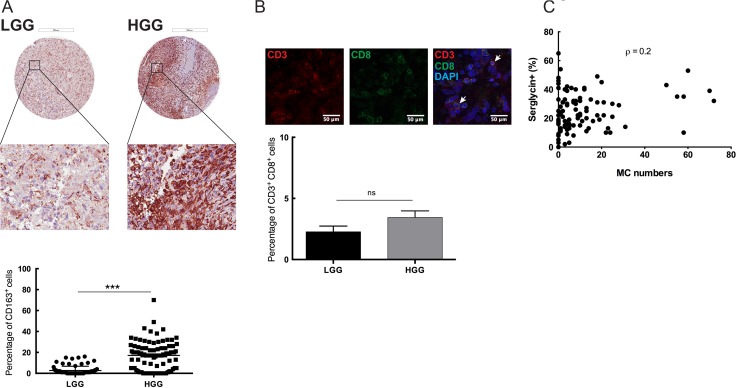
Figure 3. Immune cell infiltration in the glioma microenvironment: MCs as potential modulators of SRGN expression in GBM.
(A) Immunohistochemical staining for CD163 in human low- and high-grade glioma TMAs. Representative TMA cores of low-grade glioma (upper left panel) and high-grade glioma (upper right panel) for CD163 expression. Selected areas from upper panels are magnified in the middle panel. TMAs included tumor tissue from high-grade gliomas (anaplastic gliomas and glioblastomas, n = 101) and gliomas WHO grade II (astrocytomas, oligoastrocytomas and oligodendrogliomas grade II, n = 87). Quantification of the CD163 expression levels (lower panel) shows significantly higher CD163 expression in the high-grade glioma TMA compared to the low-grade glioma. ***p < 0.001 (B) Immunofluorescence staining for CD3 and CD8 in human glioma TMAs. Representative staining's for CD3 (upper left panel), CD8 (upper middle panel) and CD3CD8 with DAPI staining (upper right panel). TMAs included tumor tissue from high-grade gliomas (anaplastic gliomas and glioblastomas, n = 101) and gliomas WHO grade II (astrocytomas, oligoastrocytomas and oligodendrogliomas grade II, n = 87). Quantification of the CD3 and CD8 expression levels (lower panel) shows no significant difference in the CD3+CD8+ cells between the low- and high-grade glioma TMA. Data is expressed as mean values + SEM and significance differences are indicated in the figure. ns = not significant. Scale bar = 200 μm (C) Spearman's rank correlation analysis between the number of infiltrating MCs and serglycin expression level, (Spearman's rho (ρ) = 0.2). LGG = low-grade glioma, HGG = high-grade glioma.

