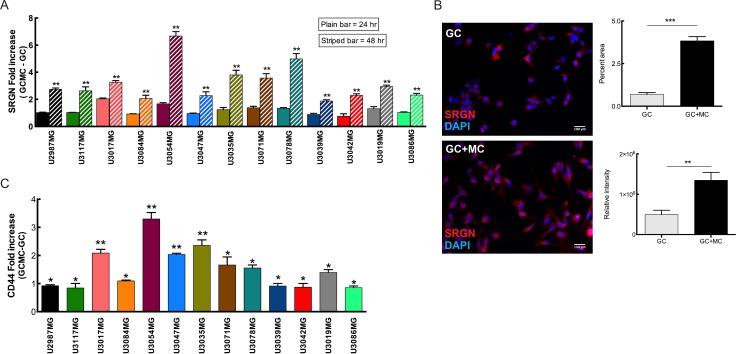
Figure 4. MCs can modulate SRGN and CD44 expression in glioma cells upon co-culture.
(A) Expression analysis of SRGN in the glioma cells after co-culture with LAD2 cells for 24 hours (plain bars) and 48 hours (striped bars) show a significant increase in SRGN expression levels at 48 hours. (B) Left panel shows representative pictures of serglycin staining in glioma cells. Left upper panel: control glioma cells and left bottom panel: glioma cells after 48 hours co-culture with LAD2 cells. Right panel shows the quantification of staining. Right upper panel: percentage area of serglycin expression, right bottom panel: relative density of serglycin staining (C) qPCR analysis for the expression of CD44 in the glioma cells after co-culture with LAD2 cells for 48 hours. Scale bar = 100 μm All the results are represented as increase in fold expression compared to the expression levels without co-culture. The experiments were performed 3 times, with triplicates in each case. Data is expressed as mean values + SEM and significance differences are indicated in the figure. GC = glioma cells, GC+MC = glioma cells co-cultured with LAD2 cells. *p < 0.05, **p < 0.01, ***p < 0.001 versus cells grown without co-culture.

