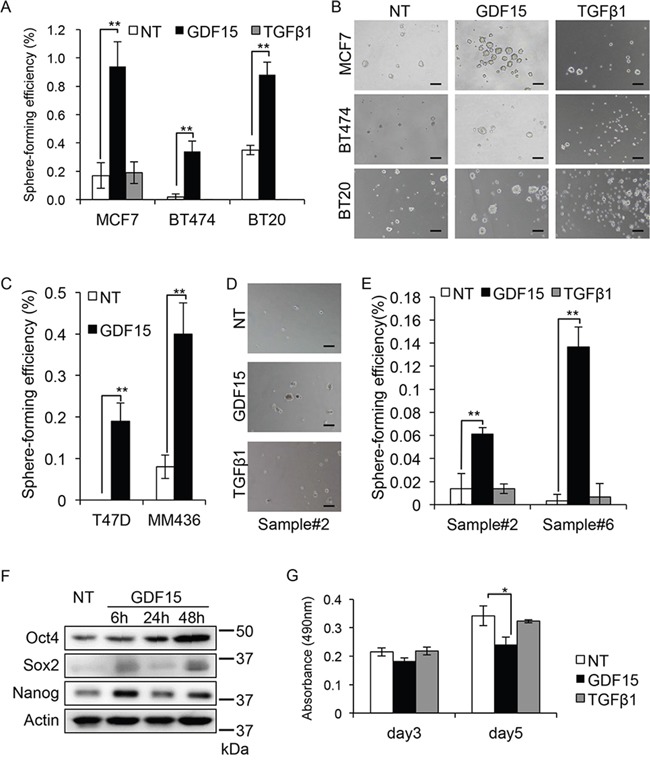
Figure 1. GDF15, but not TGFβ, efficiently induces tumor sphere formation in breast cancer cells.

A. Tumor sphere assay of cell lines treated with GDF15 (200 ng/mL) or TGFβ1 (200 ng/mL). NT, not treated. n=4. **P < 0.01. B. Representative images of tumor spheres observed in (A). NT, not treated. Scale bar: 100 μm. C. Tumor sphere assay of cell lines treated with GDF15 (200 ng/mL). NT, not treated. n = 4, **P < 0.01. D. Representative images of tumor spheres derived from clinical sample #2, treated with GDF15 (200 ng/mL) or TGFβ1 (200 ng/mL). NT, not treated. Scale bar: 100 μm. E. The number of spheres in (D) and clinical sample #6 was counted and the percentage of sphere-forming efficiency was recorded. NT, not treated. n=4. **P < 0.01. F. Immunoblotting analysis of Oct4, Sox2, and Nanog expression in MCF7 cells treated with GDF15 (200 ng/mL). NT, not treated. Actin was used as a loading control. G. MTT assay using MCF7 cells. Cells were seeded to a 96-well plate and starved overnight prior to treatment with GDF15 (200 ng/mL) or TGFβ1 (200 ng/mL). The data was recorded at the indicated time. n=3. *P < 0.05.
