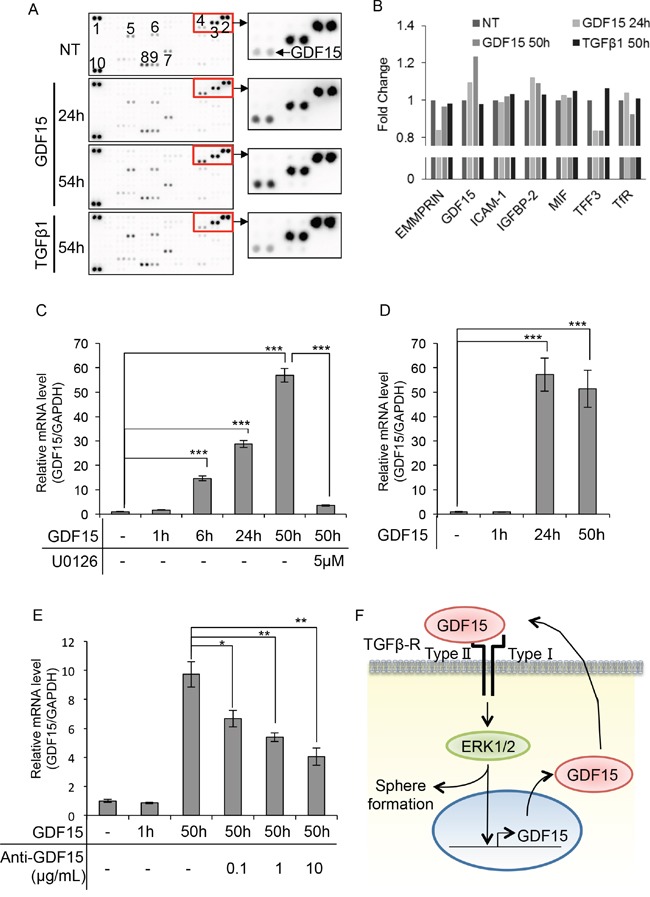
Figure 4. GDF15 induces its own expression in a delayed time course.

A. Cytokine array of MCF7 cells treated with GDF15 (200 ng/mL) or TGFβ1 (200 ng/mL). NT, not treated. The numbers of spots indicate cytokines: 1, 2, and 10, reference spots; 3, EMMPRIN; 4, GDF15; 5, ICAM-1; 6, IGFBP-2; 7, MIF; 8, TFF3; 9, TfR. B. The relative pixel densities of each spot detected in the cytokine array analyzed by ImageJ. The ratio of the number of treated cells to the number of un-treated cells for each treatment is shown in the graph. NT, not treated. n=2. C. Quantitative RT-PCR of MCF7 cells treated with GDF15 (200 ng/mL) in the presence or absence of U0126 (5 μM). Transcripts were collected at the indicated time. NT, not treated. n=3. ***P < 0.001. D. Quantitative RT-PCR of T47D cells treated with GDF15 (200 ng/mL). Transcripts were collected at the indicated time. NT, not treated. n=3. ***P < 0.001. E. Quantitative RT-PCR analysis of MCF7 cells treated with GDF15 (200 ng/mL) and the indicated concentration of the anti-GDF15 antibody. Transcripts were collected at the indicated time. NT, not treated. n=3. **P < 0.01. F. Estimated model of the GDF15-ERK1/2-GDF15 circuit in the promortion of tumor sphere formation.
