
Figure 1. Expression and function of miR-29a in GSCs.
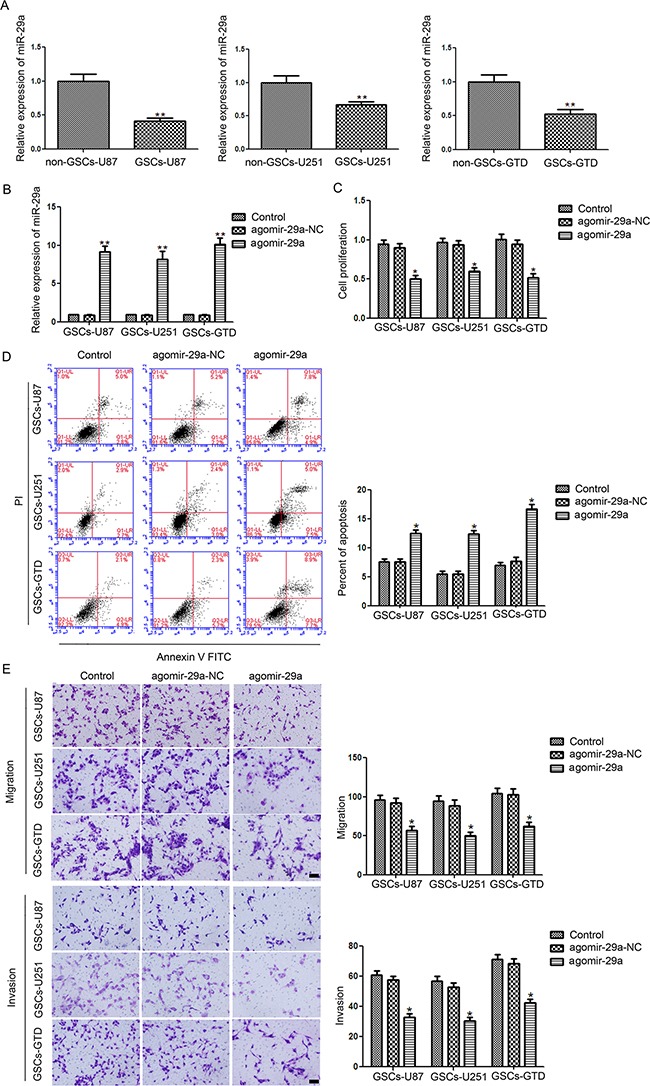
A. Relative expression of miR-29a in GSCs (CD133+) and non-GSCs (CD133-) isolated from U87 and U251 cell lines and glioblastoma tissues. *P<0.01 vs. non-GSC group. B. Relative expression of miR-29a after transfection of GSCs with agomir-29a or agomir-29a-NC which were tested by Real-time PCR. *P<0.01 vs. agomir-29a-NC group. C. CCK8 assay to evaluate the effect of miR-29a on GSC proliferation D. Flow cytometry analysis of GSCs overexpressing miR-29a. E. Quantification of cell migration and invasion in GSCs overexpressing miR-29a. Representative images and accompanying statistical plots are presented. For panels C, D, and E, *P<0.05 vs. agomir-29a-NC group. All values represent the mean ± SD from five independent experiments. Scale bar represents 80 μm. The photographs were taken at 200× magnification.