
Figure 2. QKI-6 is a direct target of miR-29a.
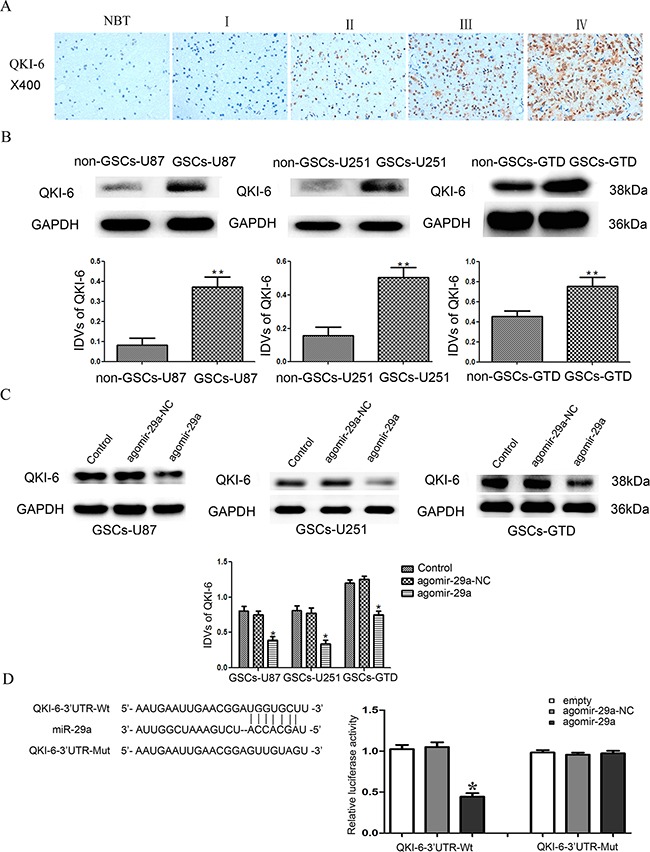
A. Representative IHC assay patterns of QKI-6 expression in glioma tissues and normal brain tissues on tissue microarray sections. The photographs were taken at 400× magnification. B. Expression of QKI-6 in GSCs (CD133+) and non-GSCs (CD133-), with GAPDH as the endogenous control. *P<0.01 vs. non-GSC group. C. Overexpression of miR-29a inhibited QKI-6 expression in GSCs; GAPDH was used as the endogenous control. *P<0.05 vs. agomir-29a-NC group. D. Reporter vector constructs and luciferase assays. *P<0.05 vs. QKI-6-3′-UTR-Wt+agomir-29a-NC group. IDVs represent the relative integrated density values. For B-D, values represent the mean ± SD from five independent experiments.