
Figure 3. QKI-6 is oncogenic in GSCs.
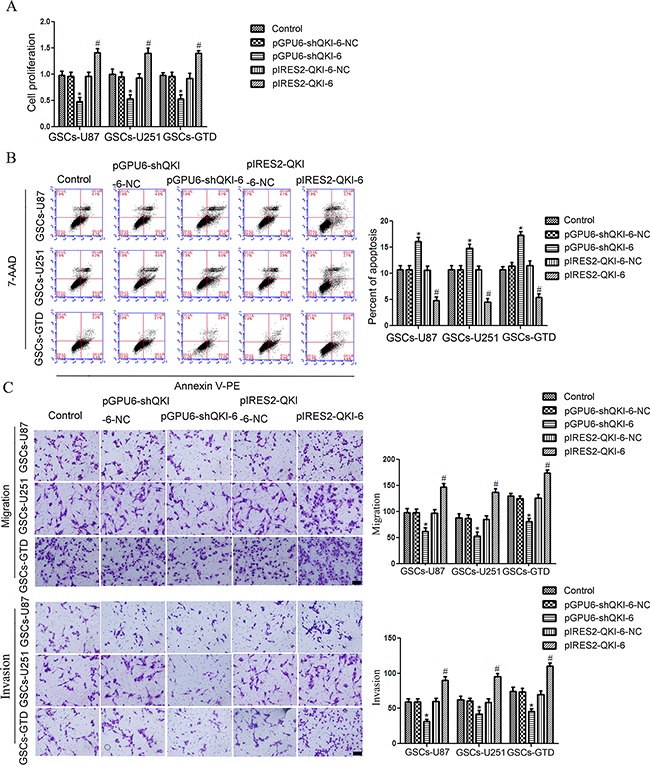
A. CCK8 assay to evaluate the effect of QKI-6 on GSC proliferation. B. Flow cytometry analysis of GSCs with altered QKI-6 expression. C. Quantification of cell migration and invasion in GSCs with altered QKI-6 expression. Representative images and accompanying statistical plots are presented. Values represent the mean ± SD from five independent experiments. *P<0.05 vs. pGPU6-shQKI-6-NC group, #P<0.05 vs. pIRES2-QKI-6-NC group. Scale bar represents 80 μm. The photographs were taken at 200× magnification.