
Figure 3. Signaling pathways in T/E expressing cells.
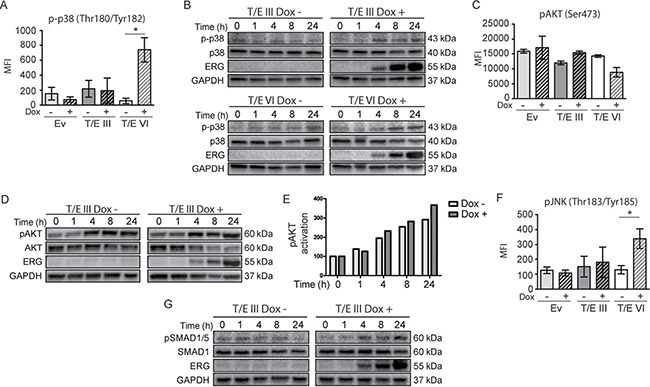
Activation of signaling molecules (p38, AKT, JNK, and SMAD1/5) in T/E expressing cells measured by Luminex technology (A, C, F), and Western blot analysis (B, D, G). For Western blot analysis, GAPDH served as loading control. Increased p38 phosphorylation (Thr180/Tyr182) was evident in T/E III (B) and T/E VI (A, B) cells. T/E III cells showed increased AKT phosphorylation (Ser473) (C, D). (E) pAKT/AKT ratios after densitometric analysis of Western blot bands of (D). (F) Increased JNK phosphorylation (Thr183/Tyr185) was revealed in T/E VI cells. Increased pSMAD1/5 phosphorylation (Ser463/465) was evident in (G) T/E III cells.