
Figure 4. The anti-proliferative effects of SU5416 in Hepa1 cells are AhR-dependent.
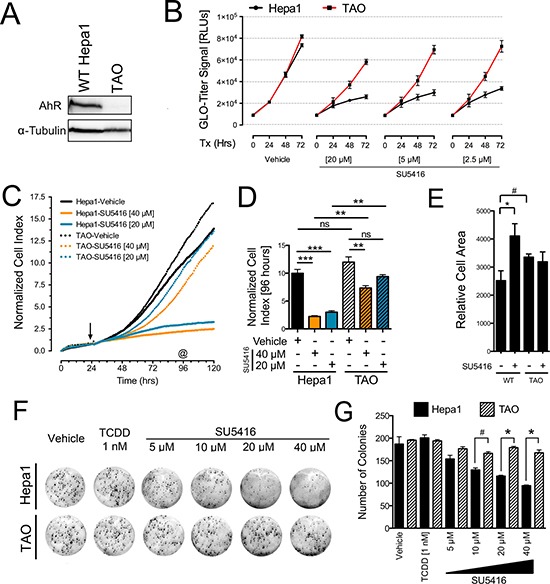
(A) Western blot depicting the relative AhR abundance in Hepa1 and TAO cells. (B) Cell-Titer Glo assays with Hepa1 and TAO cells treated with the indicated concentrations of SU5416 for 72 hrs. The data were analyzed as described for Figure 3B, and the represent the mean ± SEM, n = 3. Data are representative of three independent experiments. (C) xCelligence real time proliferation analysis of Hepa1 and TAO cells (initial seeding density 1000 cells/ well). Initiation of treatments is depicted by an arrow. (D) ANOVA analysis of the 96 hr time point (72 hr treatment, indicated by as in C); **p < 0.01, ***p < 0.001, n = 2. (E) Cell area of Hepa1 and TAO cells treated with vehicle or SU5416 [40 μm] for 48 hrs. Bars indicate the mean ± SEM surface area of cells obtained from five representative images, and are expressed as relative cell area (arbitrary units2); #p < 0.05, *p < 0.01. (F) Colony formation assay showing the sensitivity of Hepa1 cells vs Tao cells to SU5416. Cells were treated for 24 hours with vehicle, TCDD, or SU5416 at the indicated concentrations, after which the media was replaced with normal cell culture media (G) ANOVA analysis of colony counts, #p < 0.05, *p < 0.01.