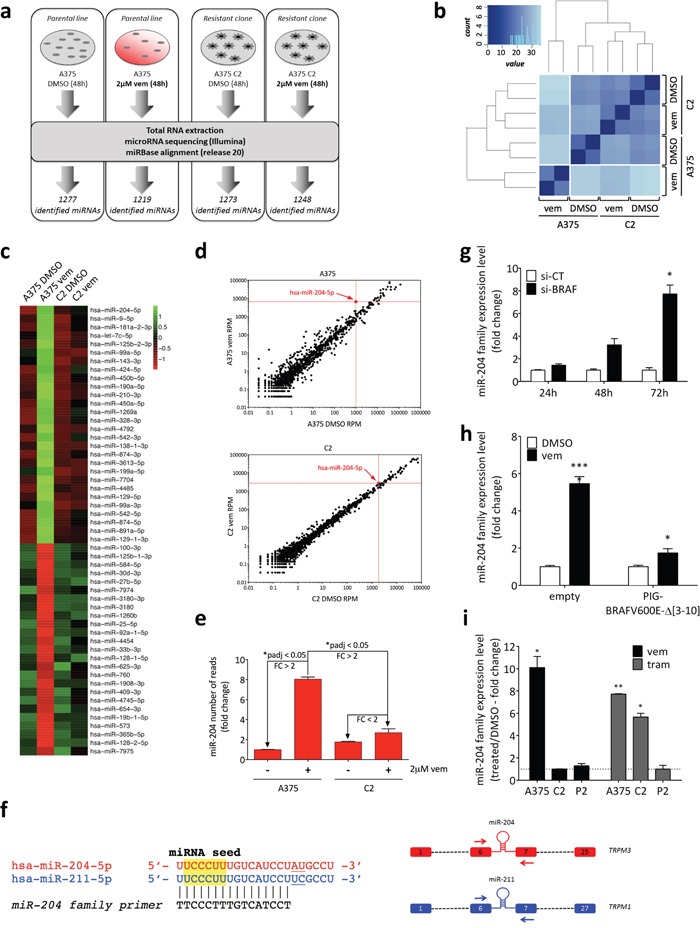
Figure 2. Identification of miR-204 as a microRNA regulated by BRAFV600E through the ERK pathway.

(a) Experimental design of miRNA-seq. A375 parental cell line and A375 C2 vemurafenib-resistant clone were treated with vehicle (DMSO) or 2uM vemurafenib for 48h. RNA was extracted and used to perform the miRNA-seq. (b) Sample clustering based on the distance matrix of miRNA profiles. Euclidean metric was used to measure the distance between samples. Darker blue represents higher similarity. (c) Heatmap of differentially expressed miRNAs. Variance-stabilized transformed count data is scaled and centered. (d) Dotplot of the miRNAs differentially expressed in A375 vemurafenib vs A375 DMSO (upper) and in C2 vemurafenib vs C2 DMSO (lower). (e) miR-204 reads obtained from miRNA-seq, relative to control (A375 treated with DMSO). In both (d) and (e), the graphs show that miR-204 levels are induced in A375 vemurafenib, but not in C2 vemurafenib. (f) (left) Sequence of miR-204 family members, miR-204 and miR-211. The sequence of the “miR-204 family” real-time PCR primer is also reported. (right) Schematic representation of miR-204 and miR-211 host genes (TRPM3 and TRPM1, respectively). Red and blue rectangles: exons; dashed lines: other exons/introns; arrows: host gene-specific real-time PCR primers. (g) Time course of miR-204 expression levels after the gene-expression inhibition of BRAF by siRNA. (h) miR-204 levels after 48h of treatment with 2uM vemurafenib in cells stably expressing the BRAFV600E Δ [3–10] splicing variant compared to the empty vector. (i) miR-204 expression levels in A375 parental cell line and C2 and P2 vemurafenib-resistant derivatives after treatment with 2uM vemurafenib or 1nM trametinib for 48h. Vemurafenib and trametinib treatments are normalized on the control samples (DMSO, dotted line). The graphs represent the mean±SEM of 3 independent experiments. *p<0.05, **p<0.01, ***p<0.001.
