Figure 2.

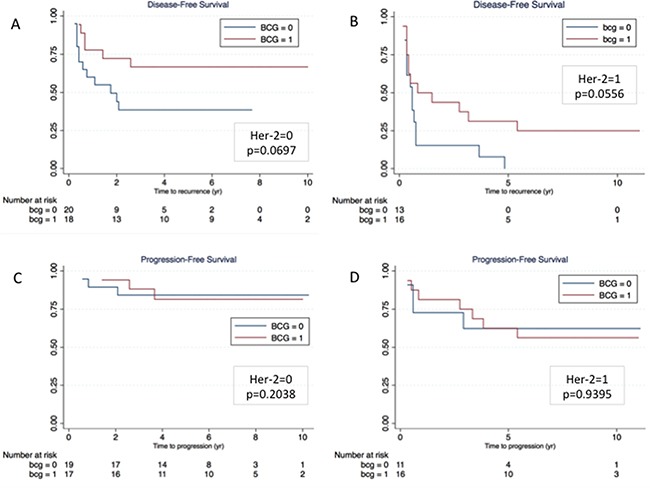
Kaplan-Meier curves of disease-free (A and B) and progression-free survival (C and D) according to HER-2 status (Panel A and C = HER-2 negative; Panel B and D = HER-2 positive).

Kaplan-Meier curves of disease-free (A and B) and progression-free survival (C and D) according to HER-2 status (Panel A and C = HER-2 negative; Panel B and D = HER-2 positive).